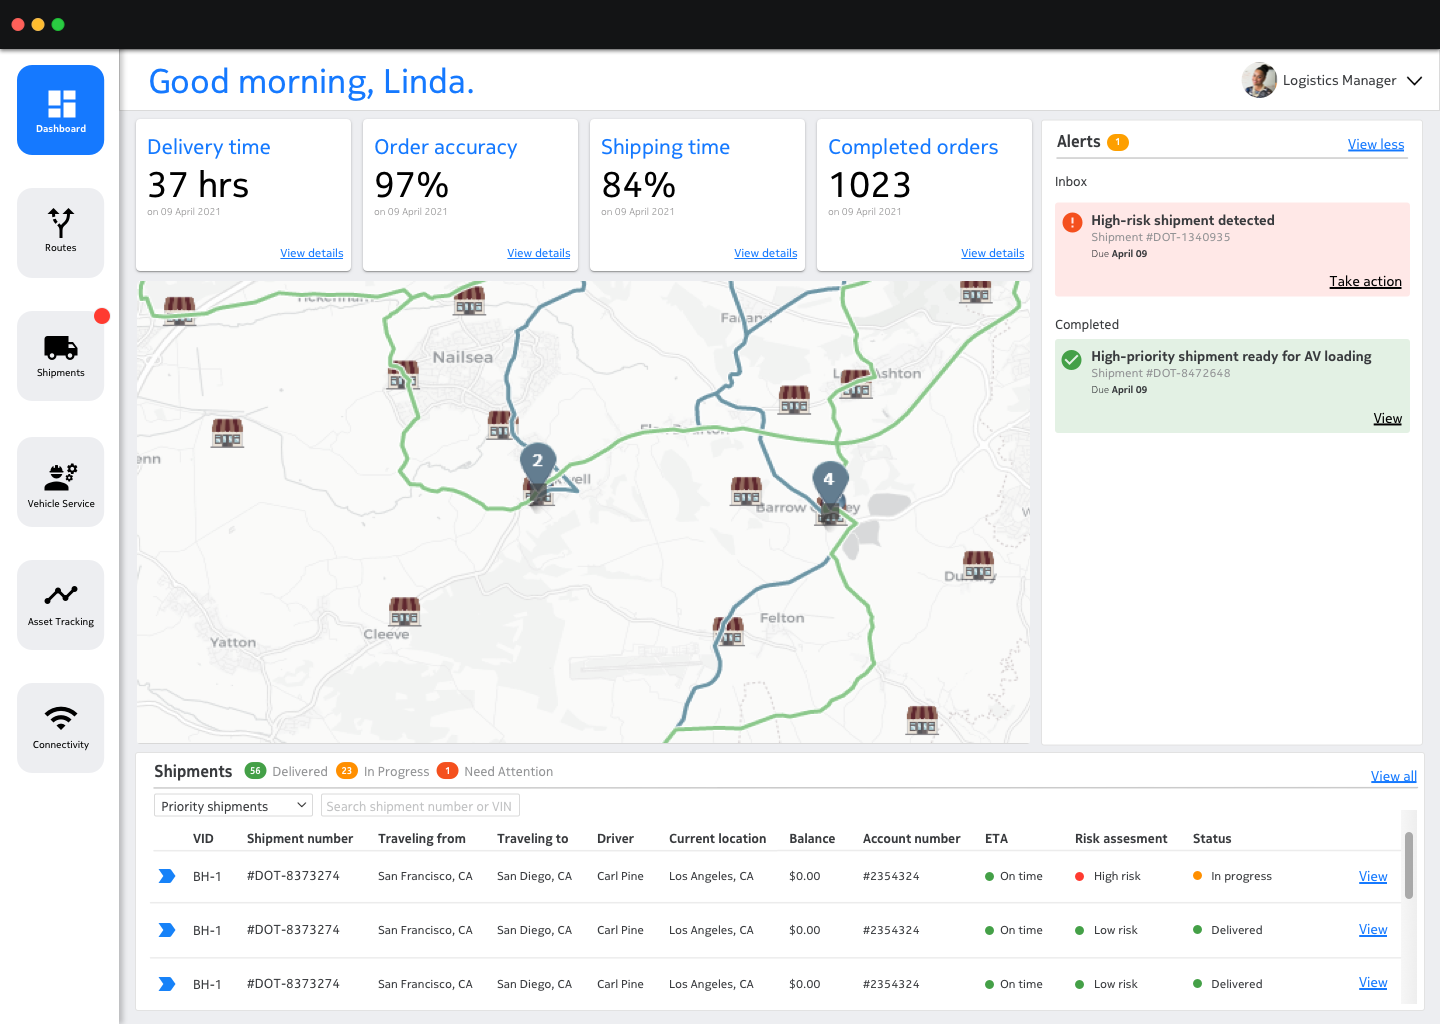
Day-to-Day of 5G-Enabled Shipping & Logistics
The transport of cold-chain pharmaceuticals relies on seamless network connectivity. Our Velocity B2B demo tells that story in a fresh way.
Project Specs
Duration
4 months
Deliverable
high-fidelity clickable prototype
Tools
Miro
Sketch
Marvel
Team
Edie Terrell - interaction design intern
Norah Shang - interaction design intern
Taylor Chambers - content strategist
Rob Furlano - program director
As the lead designer, I scoped the project with the program director, lead user interviews, facilitated design thinking workshops, designed and prototyped high-fidelity mockups, managed intern workflows, and delivered the final demo to an audience of 40 technical sales folks upon project completion.
Challenge
With one Velocity demo under our belt, our team embarked on another demo, this time with a B2B use case. We knew that we wanted to use the same format as our B2C demo—that is, a customer-journey-centered clickable prototype that explored a user’s day-to-day and the Nokia products behind the scenes—but aside from that, we didn’t know which vertical our demo would tackle, or which products it would cover. It was time to get to work.
Challenge
The global sales center desires another Velocity demo, this time focusing on a 5G-enabled B2B use case.
Solution
Through learnings from stakeholder conversations, we decided to tell a story through the day-in-the-life of a 5G-enabled shipping and logistics manager for cold-chain pharmaceuticals.
Process
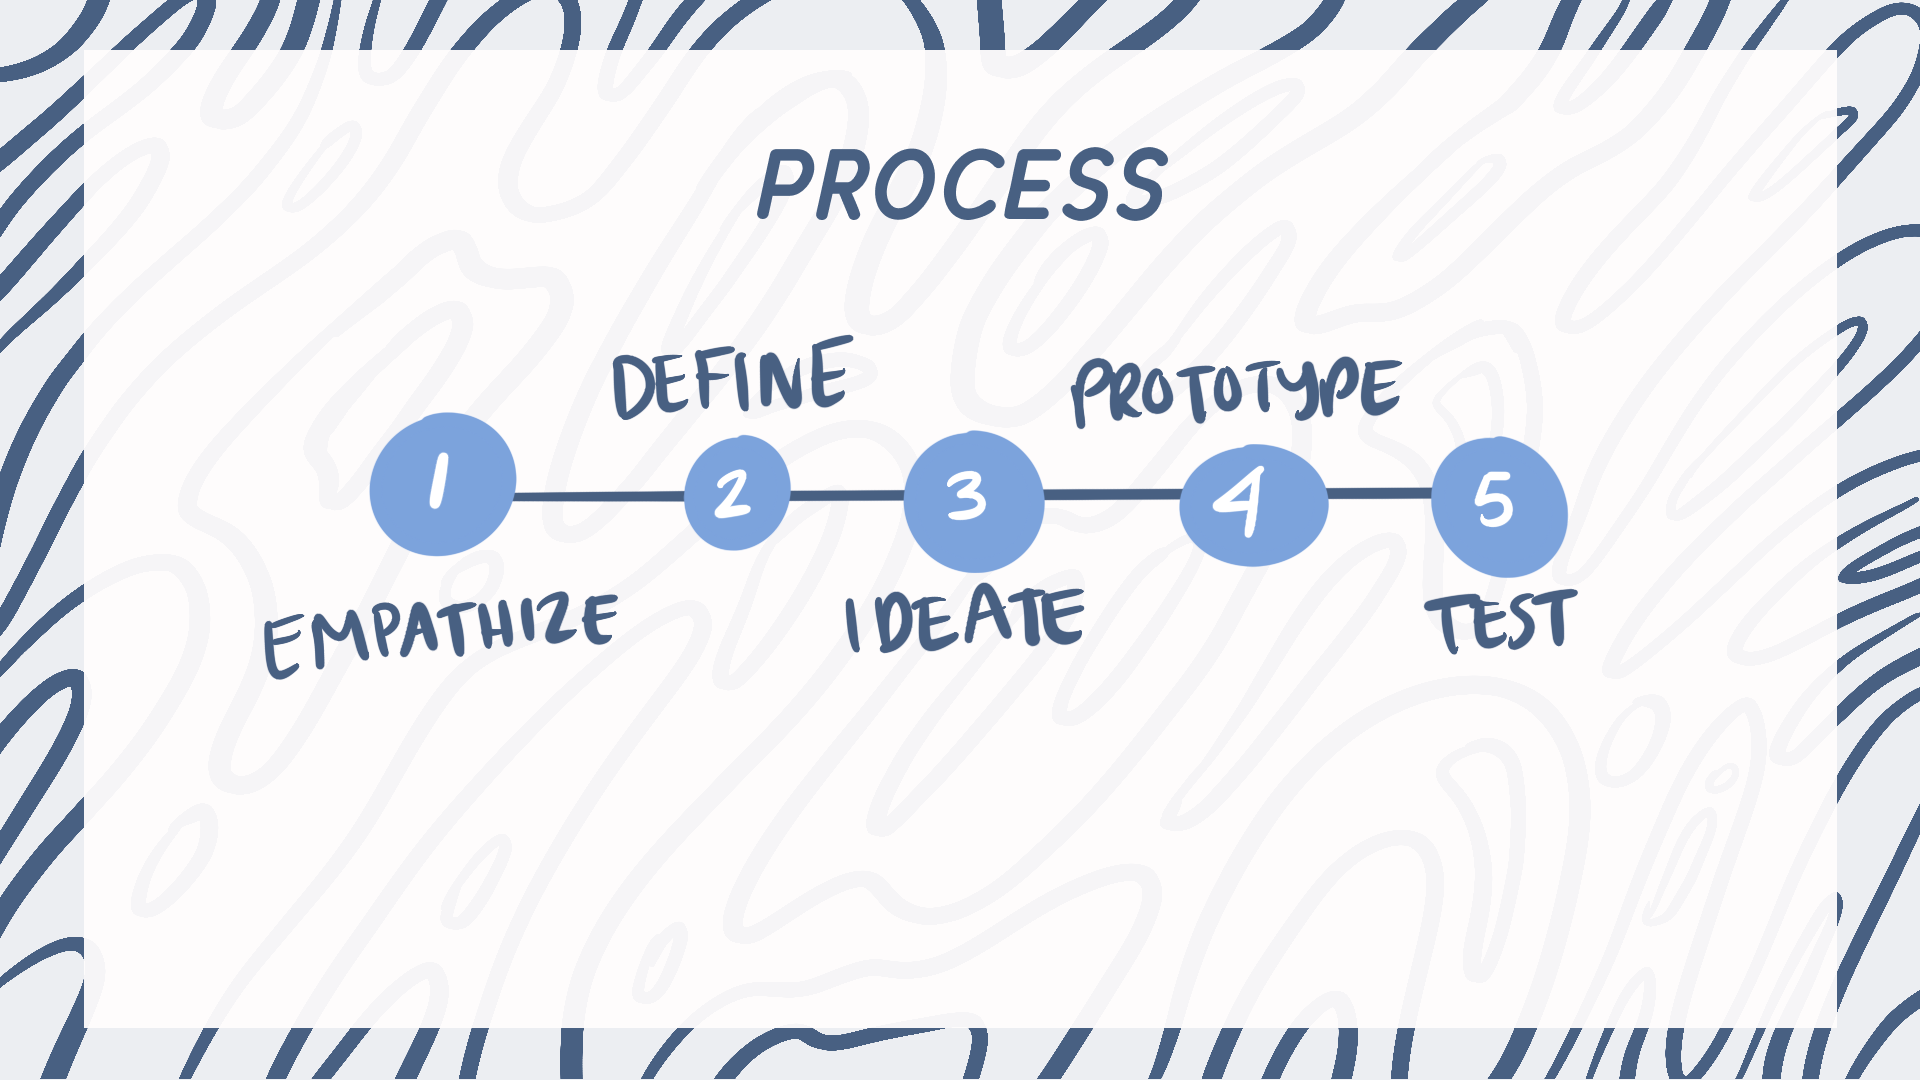
Empathize
Our process started by going to the future users of our demo: Nokia’s global technical sales team. Edie, Norah, and I conducted 8 stakeholder interviews with members from Nokia’s seven global sales regions, as well as the Head of Technology for the technical sales team in India.
Our goal was to uncover an industry vertical for our demo that would be broad enough to appeal to the different sales regions, but specific enough to be relevant and interesting.
Abhay Savargaonkar
Technical Sales Head of Technology
India Region
Roberto Quintana-Lajara
Technical Sales Lead
North American Region
Lei Xia
Technical Sales Lead
Greater China Region
Renan Russo
Technical Sales Lead
Latin American Region
Reynu Vittolia
Technical Sales Lead
India Region
Norman Miranda
Technical Sales Lead
Asia Pacific and Japan Region
Martin Keller
Technical Sales Lead
European Region
Hossam El-Geneidy
Technical Sales Lead
Middle East and African Region
Through the interviews we learned that asset management and cold chain shipping/logistics were hot use cases across multiple regions.
“Asset management is conducive to many verticals. If generalized, you could argue it applies to vaccines, food in hospitality, airports, etc.”
- Roberto Quintana-Lajara
“Cold chain is applicable to good, agriculture logistics, pharmaceuticals in general. If you’re able to do something around cold chain, that would be great because it’s hot and in demand right now.”
- Reynu Vittolia
“For [one of our biggest customers], shipping and logistics is the number two use case, second only to smart factories.”
- Roberto Quintana-Lajara
Equipped with this information, we scheduled additional interviews with the Head of Enterprise Sales for logistics and Nokia’s own North American shipping hub manager.
Thomas Hanziel
Head of Enterprise Sales, Logistics
European Region
Jothika Sahib
Hub Manager, Nokia Logistics
North American Region
Thomas validated the need for our user-centric Velocity demos, while Jothika instilled a sense of urgency surrounding her fulfillment timeline.
“[Not leading with the technical angle] is the only way you can [sell] with enterprise, or else you will fail.”
- Thomas Hanziel
“[Once we receive assets], there are a lot of things missing or not in place. I have to ensure everything is fulfilled in 48 hours. And this point in time, everything is manual.”
- Jothika Sahib
Define
At this point, the team decided on a cold chain pharmaceutical shipping and logistics use case. We then developed a persona, Linda, who is the shipping and logistics manager for a company called Dot Manufacturing.
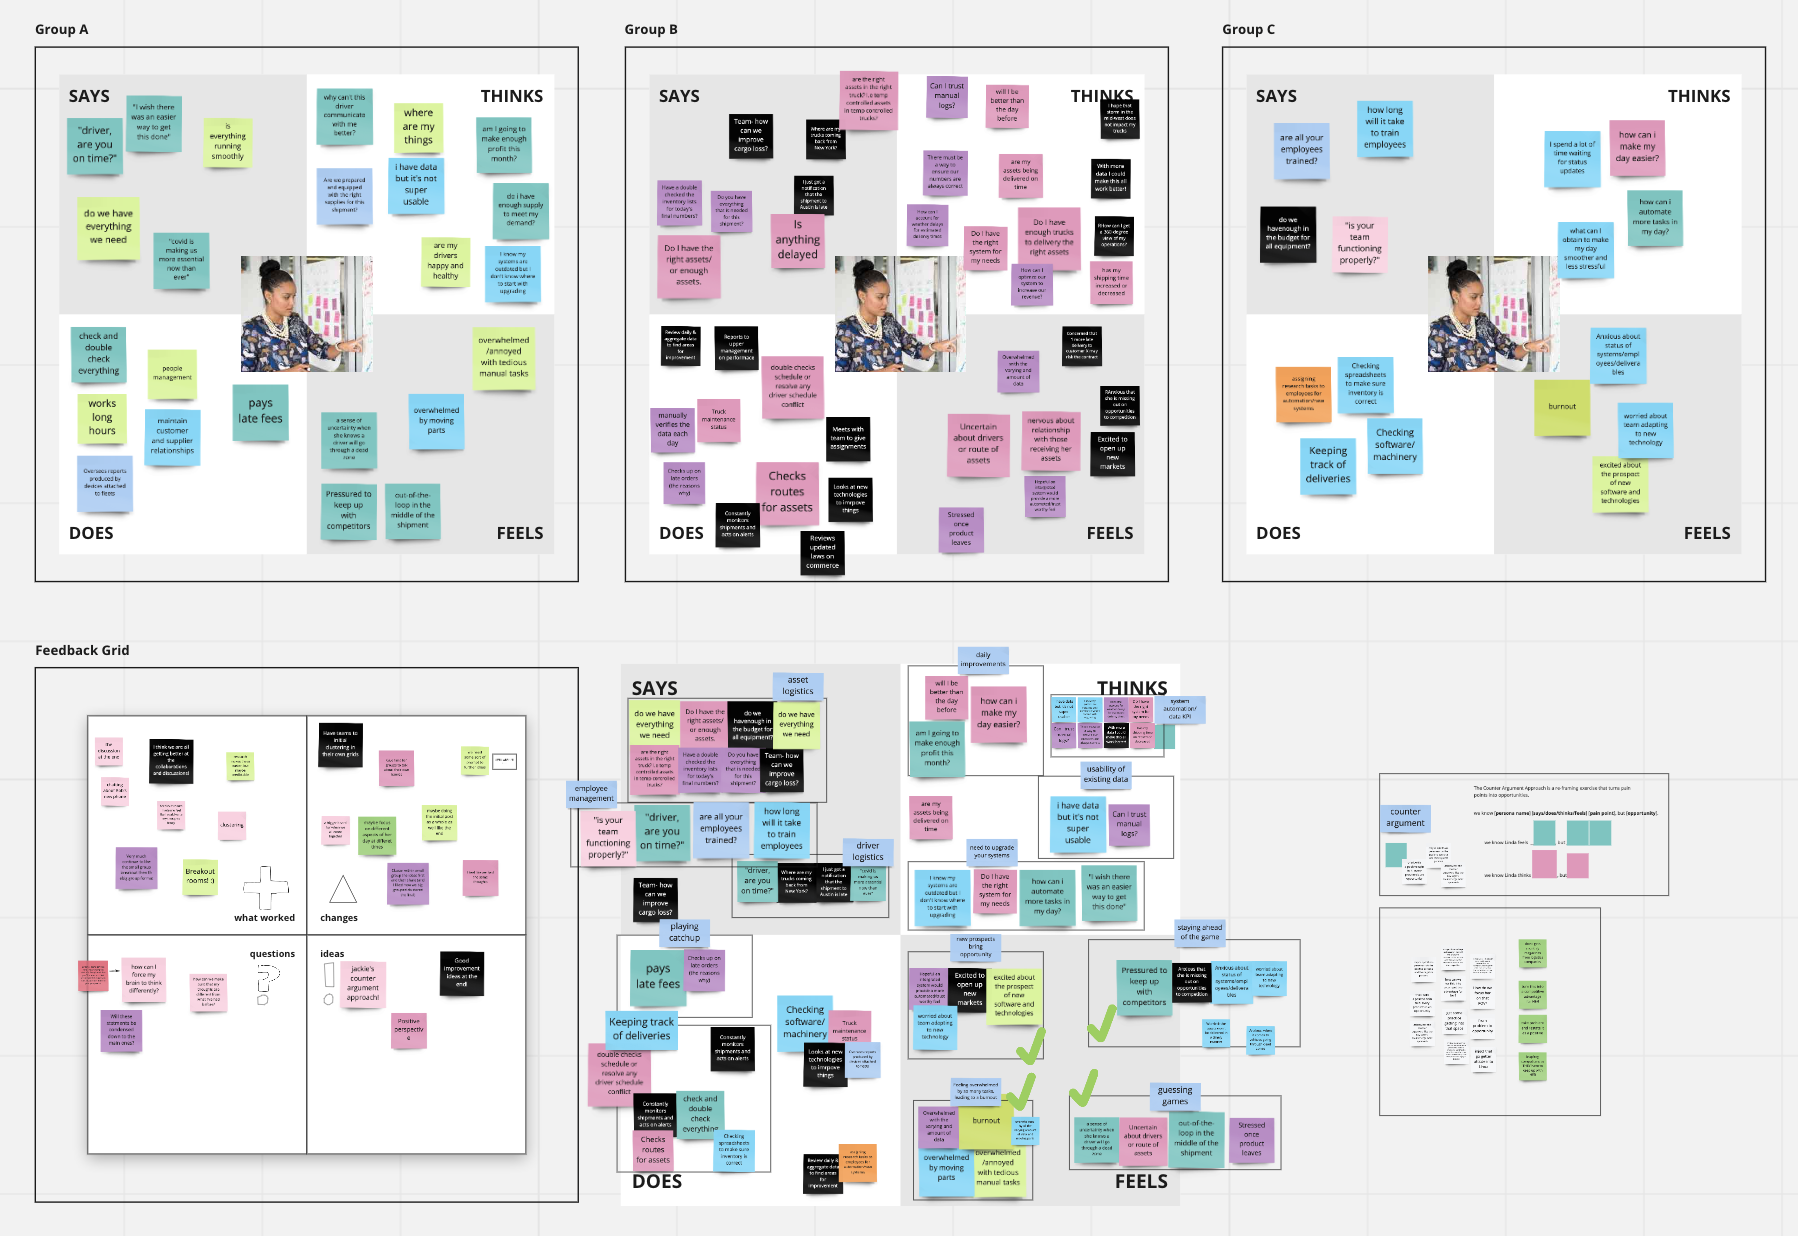
Linda faces a number of inhibiting factors in her daily operations as a shipping and logistics manager.
Inhibiting Factor #1
Lack of real-time data causes low visibility of assets after they leave Linda’s warehouse.
Inhibiting Factor #2
Inefficient manual systems impede on Linda’s tight fulfillment window.
Inhibiting Factor #3
Variables like poor weather puts deliveries at risk of late fees.
From these inhibiting factors, I crafted three insights statements.
Insight #1
Black holes in the supply chain cause stakeholders to feel low transparency and trust in Linda’s company.
Insight #2
Introducing reliable automation to Linda’s daily operations minimizes stress and frees time to focus on customers and expand her business.
Insight #3
The stakes are high for Linda to deliver in her time window, or else she risks fees, late deliveries, and poor relationships with customers.
Ideate
Next, I facilitated an as-is scenario map activity with the team to demonstrate an understanding of Linda’s daily operations and pain points as they exist in the current state of operations. The map follows Linda’s assets as they enter the warehouse, leave the warehouse, are in transit, and arrive at their destination.
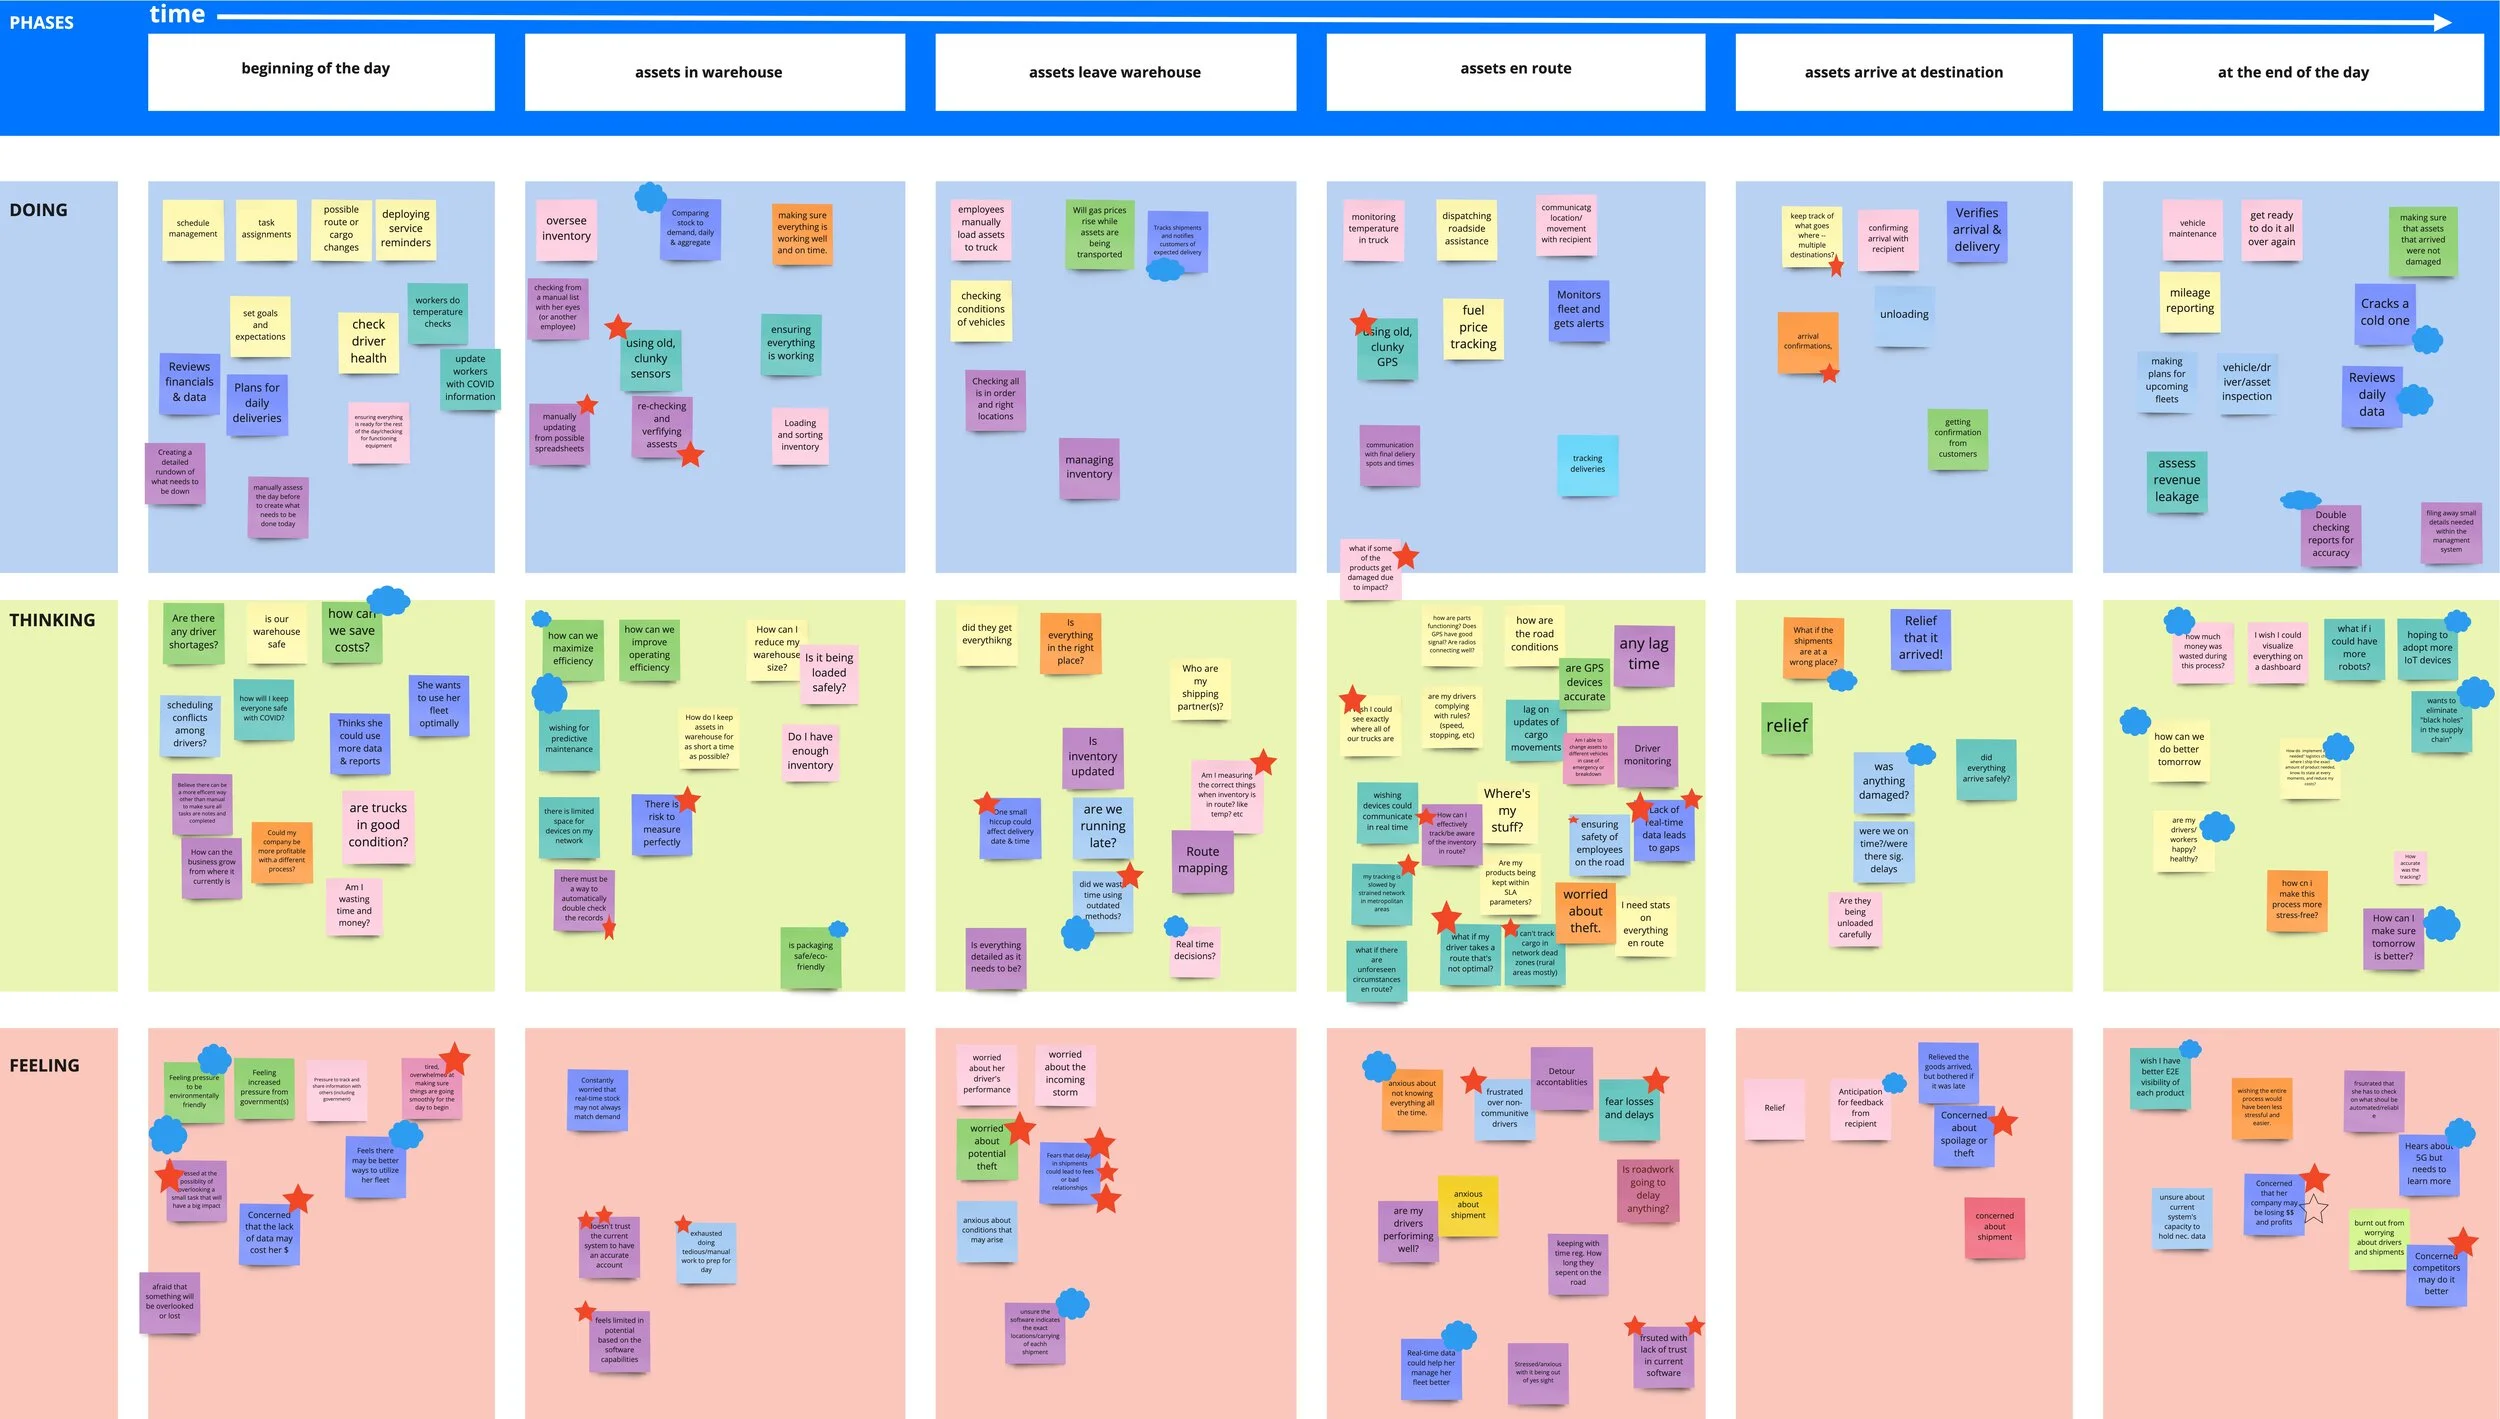
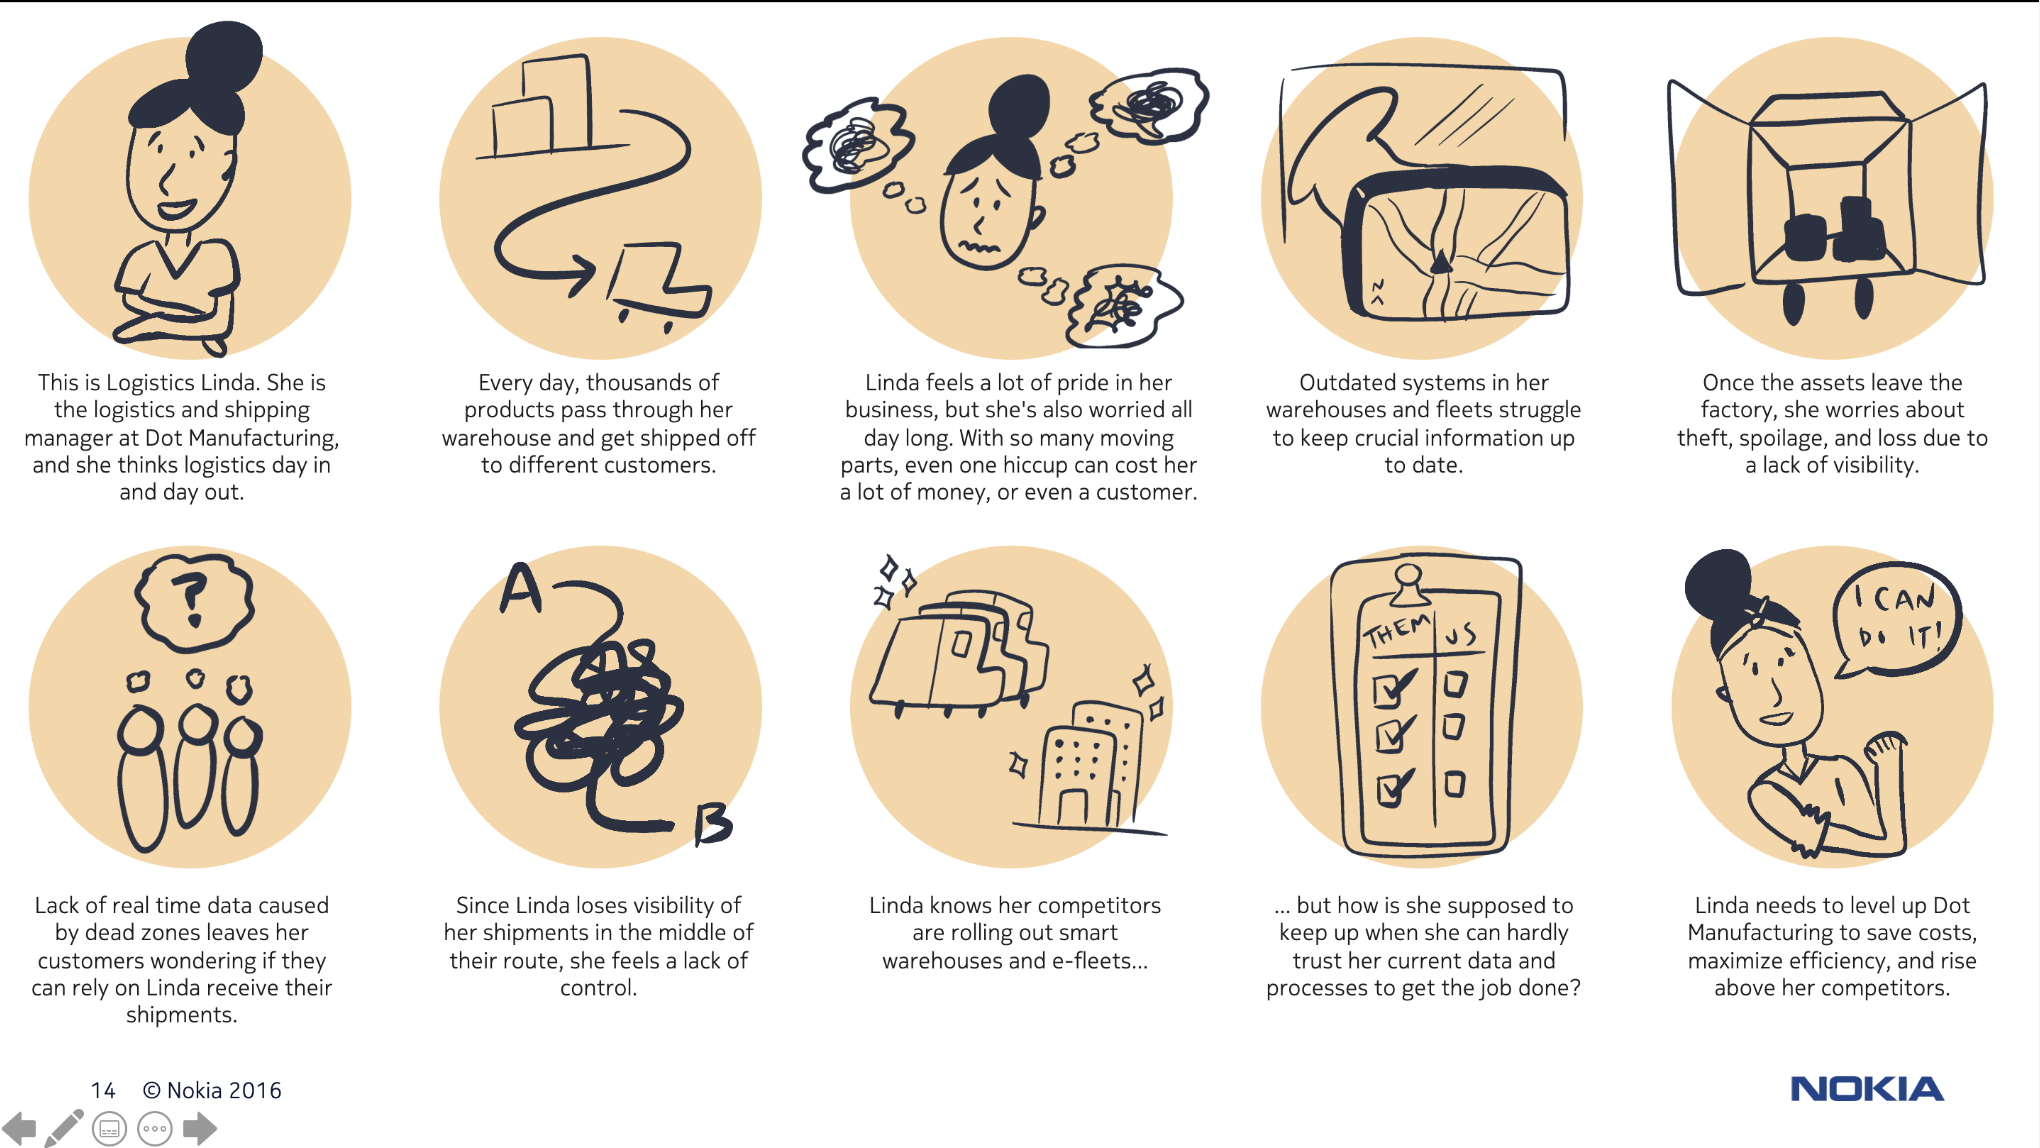
From the journey map, I developed a storyboard, first sketching on paper, then digitizing it into a deliverable that could be circulated to the wider team for validation.
I have developed a 10-step framework for completing as-is storyboards, which is outlined below:
Introduce your persona
Set the stage
Introduce their pain
Introduce pain point A
Introduce pain point B
Introduce pain point C
Up the stakes
Reality check
Call-to-action
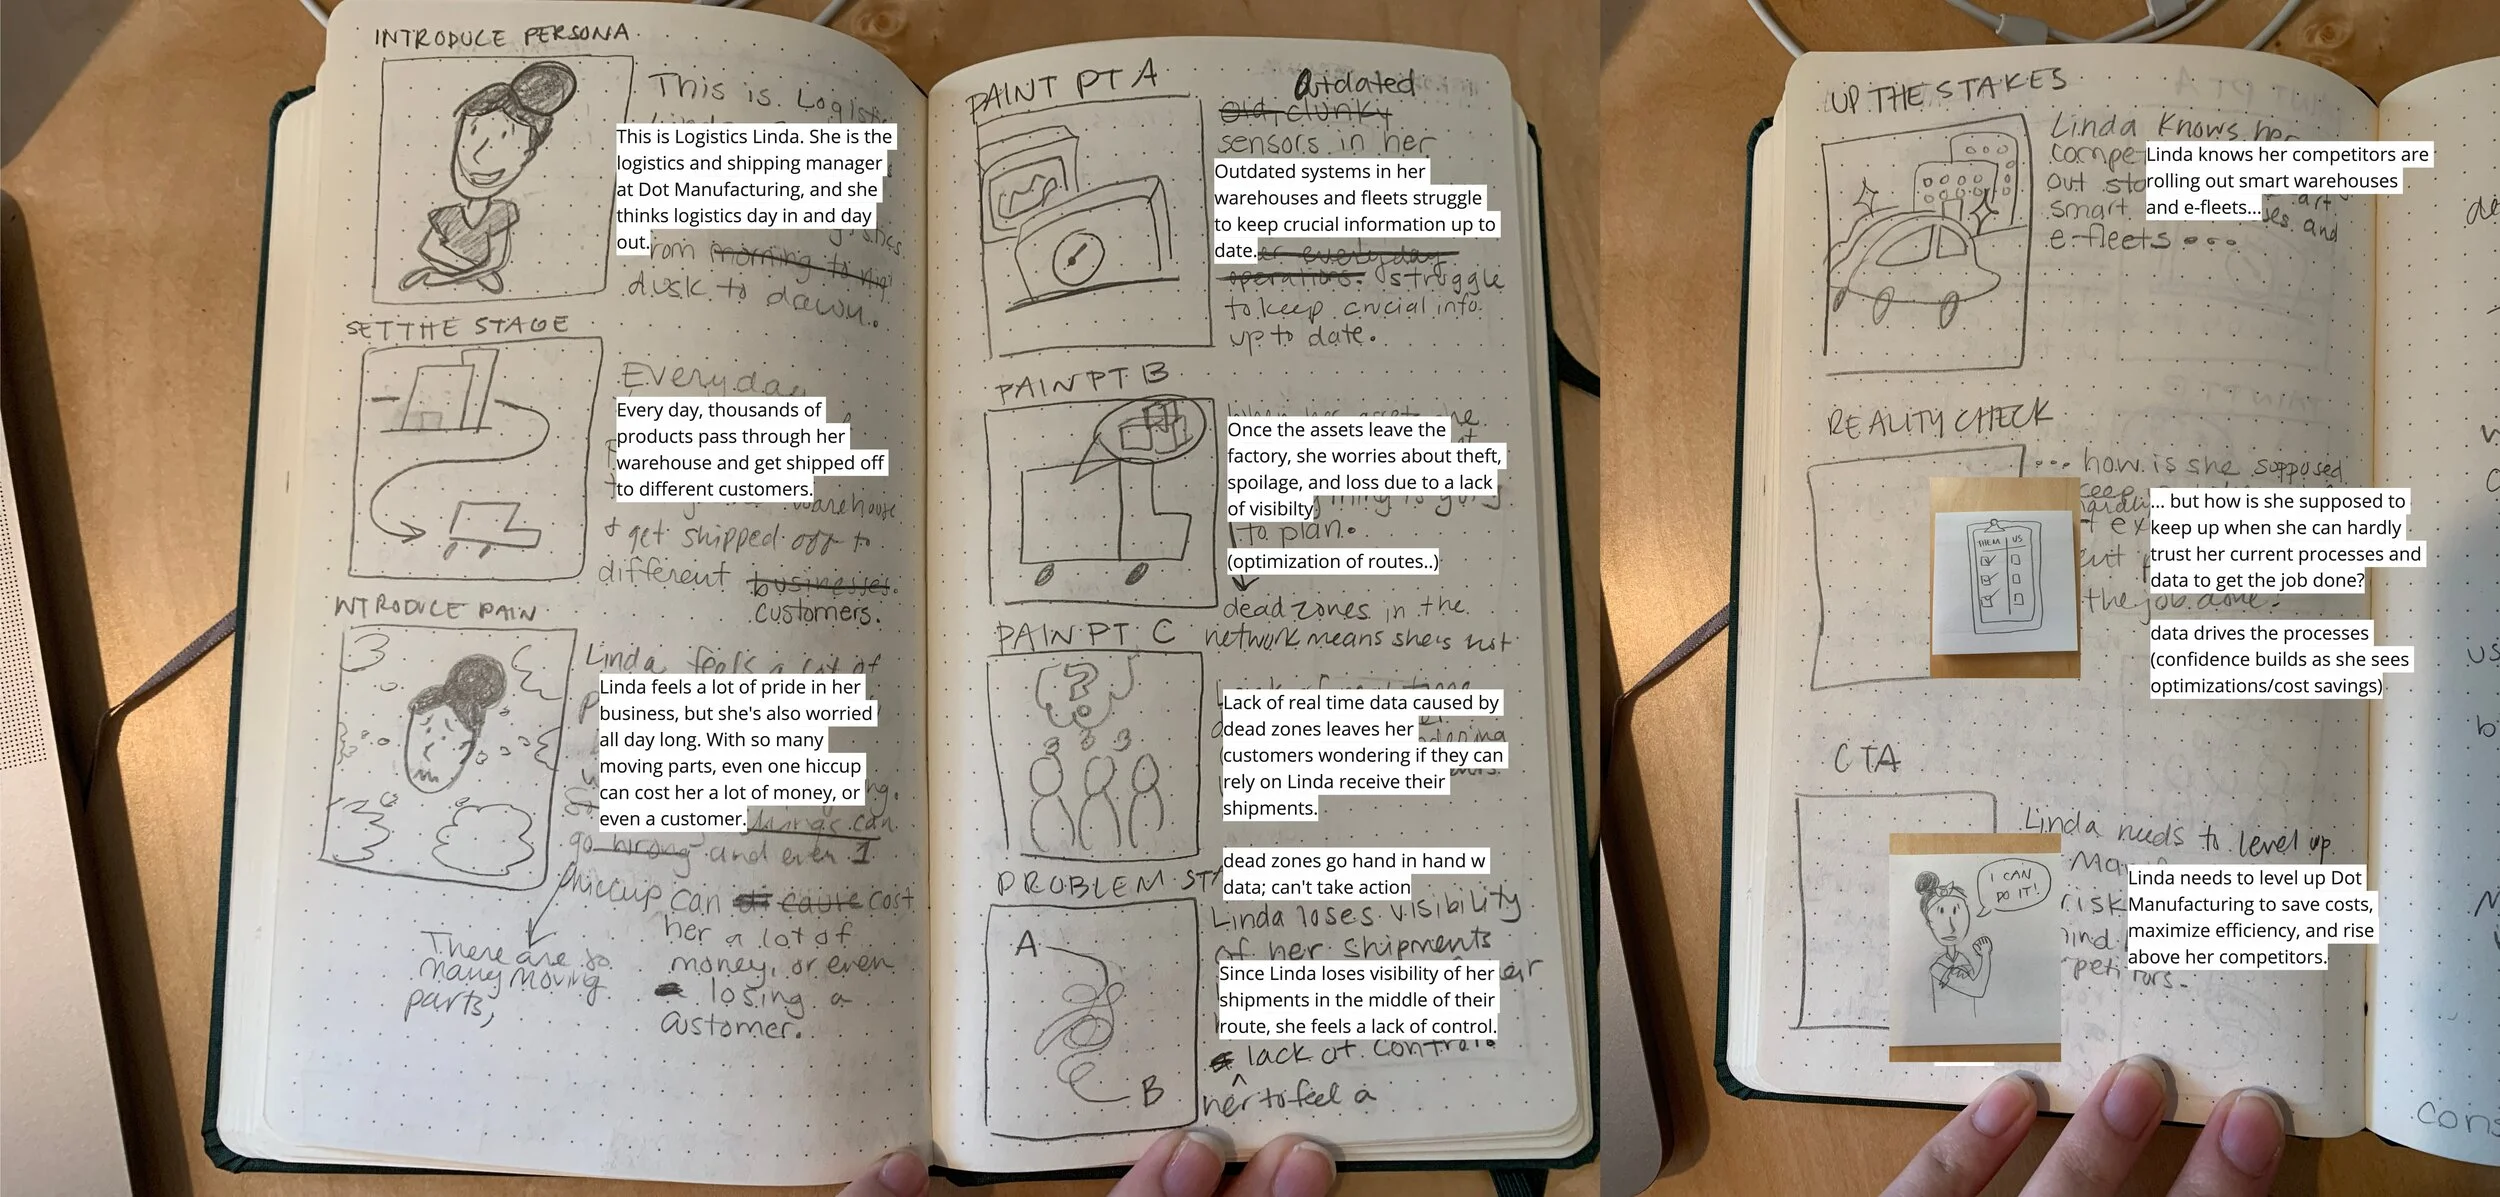
The digitized version was created using Procreate and PowerPoint.
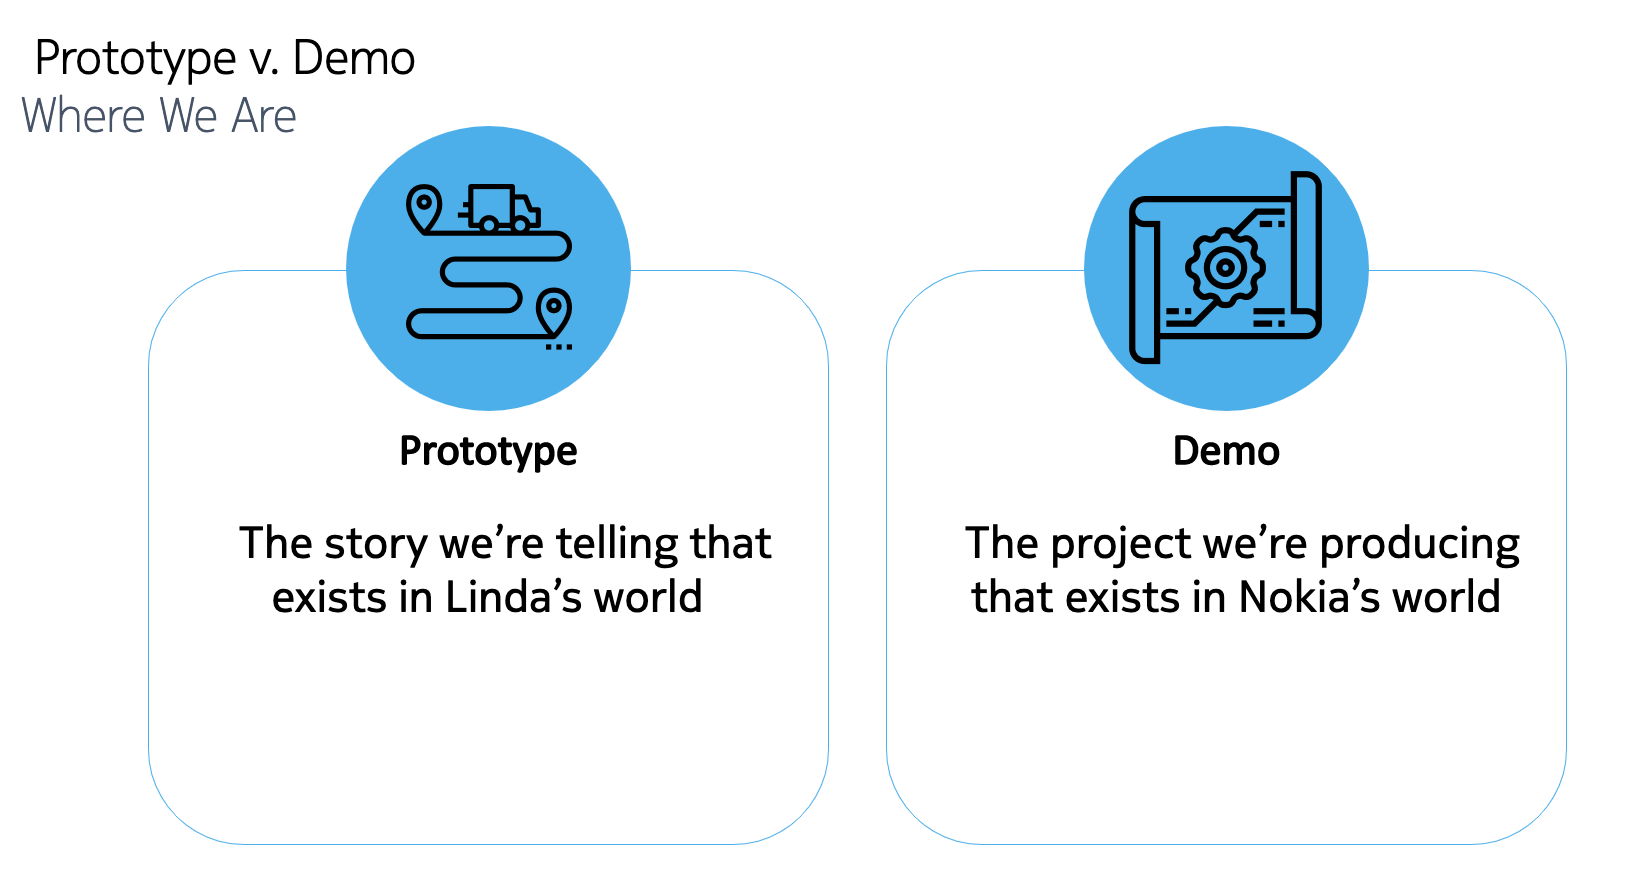
Next, it was important for us to lay down some design principles that would guide us through the rest of our project. We found the need to differentiate between the prototype and the demo we were building in order to focus the design principles.
The design principles for our prototype outlined that our solution would:
1. Empower Linda and her team
2. Increase transparency in the supply chain
3. Not just show real-time data, but make it actionable
4. Pull Linda ahead of her competition
Considering our demo, our solution would:
1. Highlight Nokia’s behind-the-scenes value
2. Be versatile enough to support different customer conversations
3. Lend itself to engaging storytelling
In the Ideate Phase, I facilitated a number of design thinking activities, including Crazy 8s, a Prioritization Grid, and a To-Be Scenario Map.
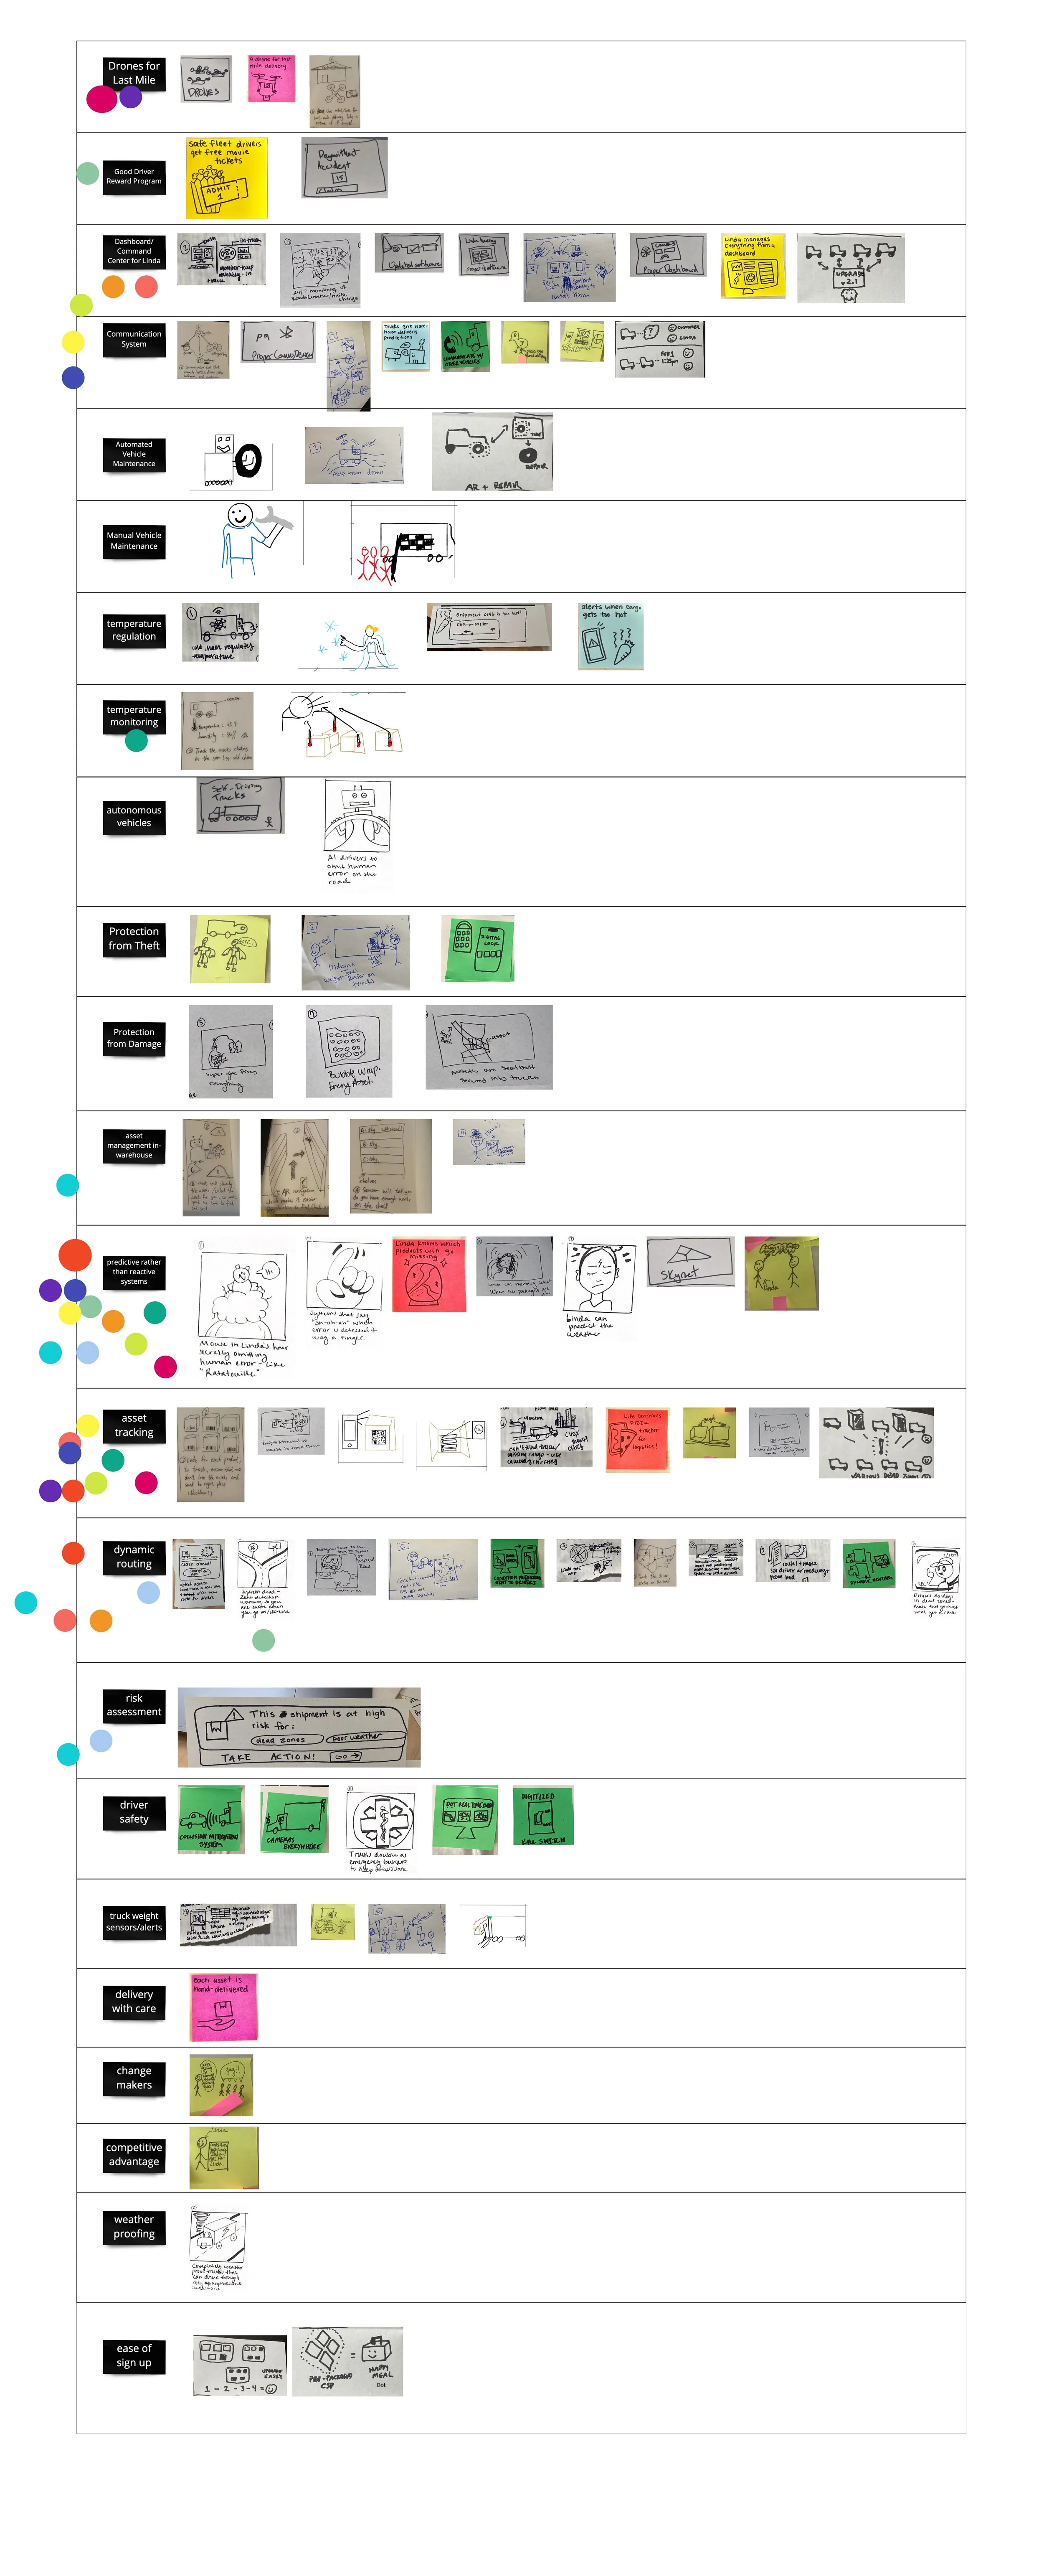
Crazy 8s allowed the entire team to visualize and conceptualize solutions to Linda’s pain points.
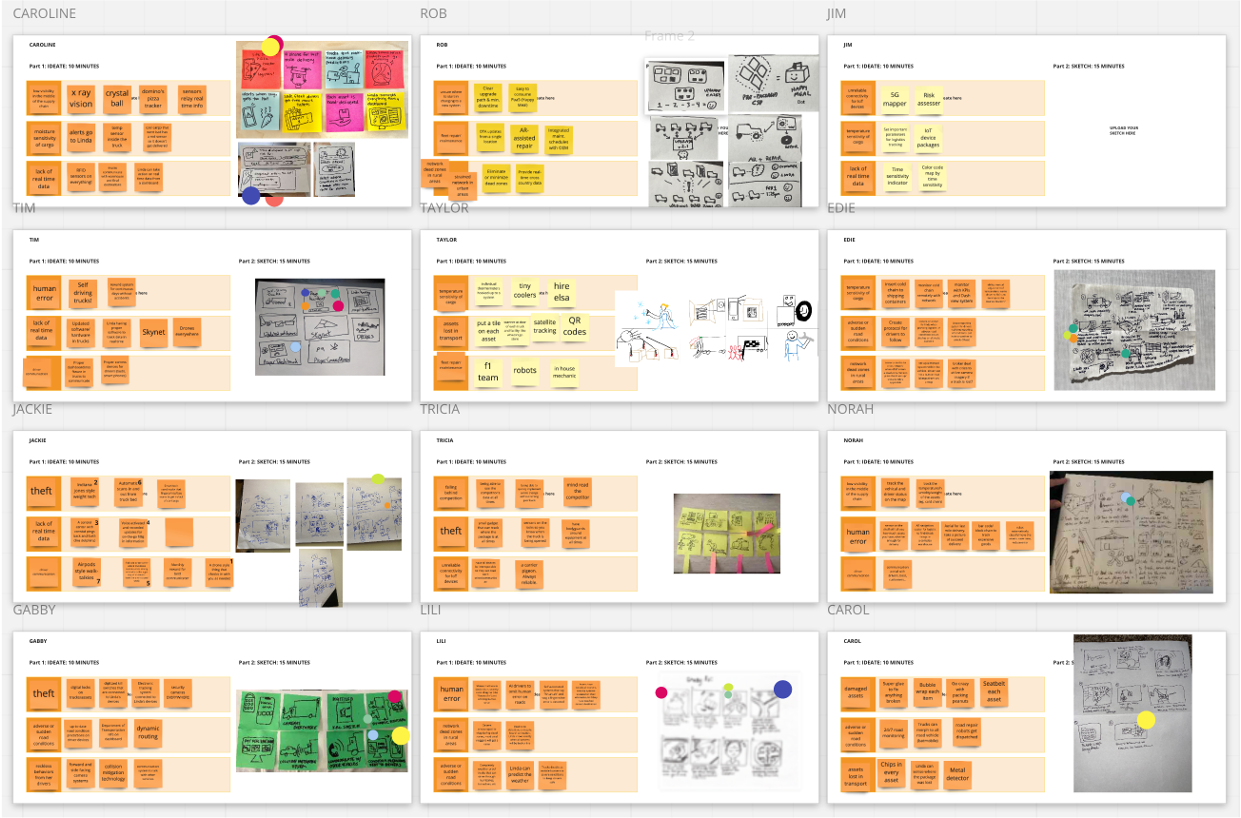
Some interesting concepts that came out of Crazy 8s included predictive systems, a dashboard interface, dynamic rerouting, and asset tracking.
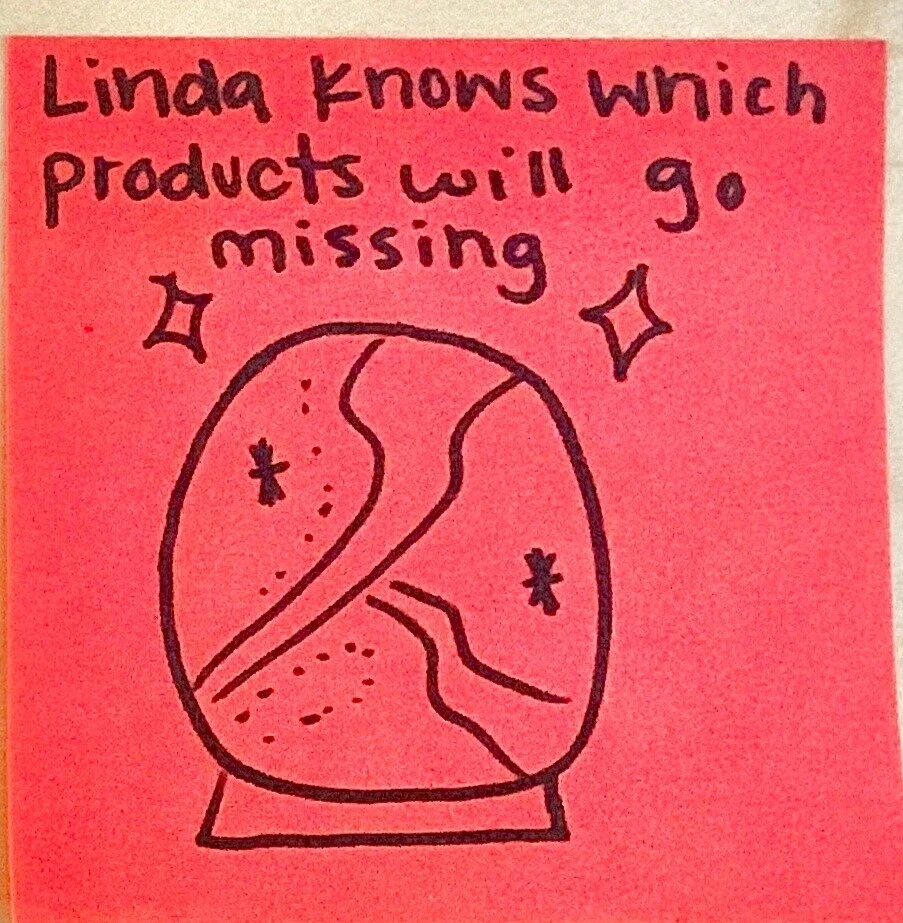
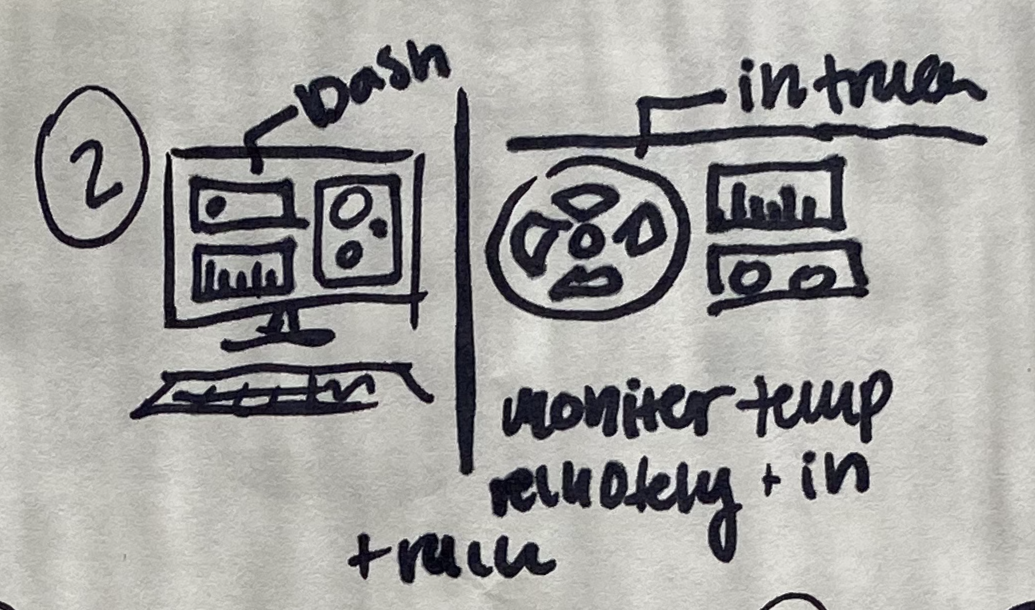
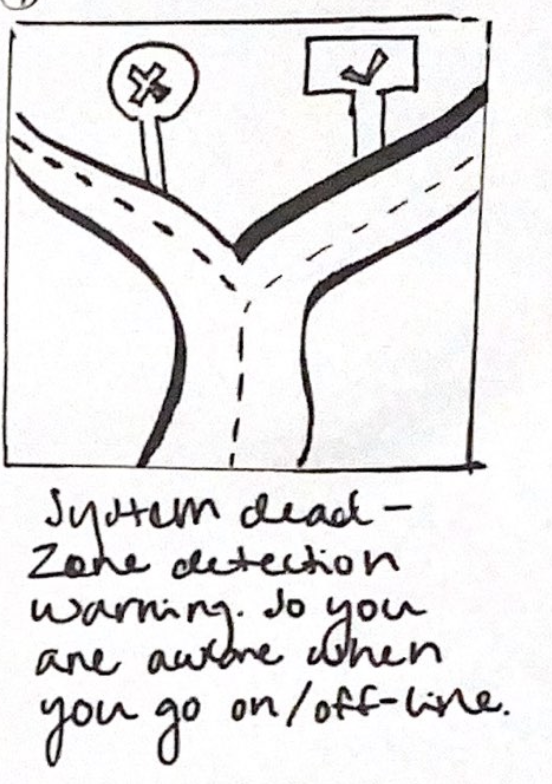
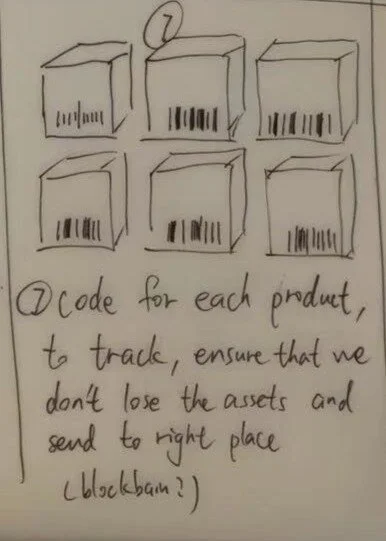
Next, I took each drawing and grouped them into clusters of common themes, ending up with over 20 clusters. I took that document to the team and had everyone dot-vote for the categories that best addressed the pain points and design principles.
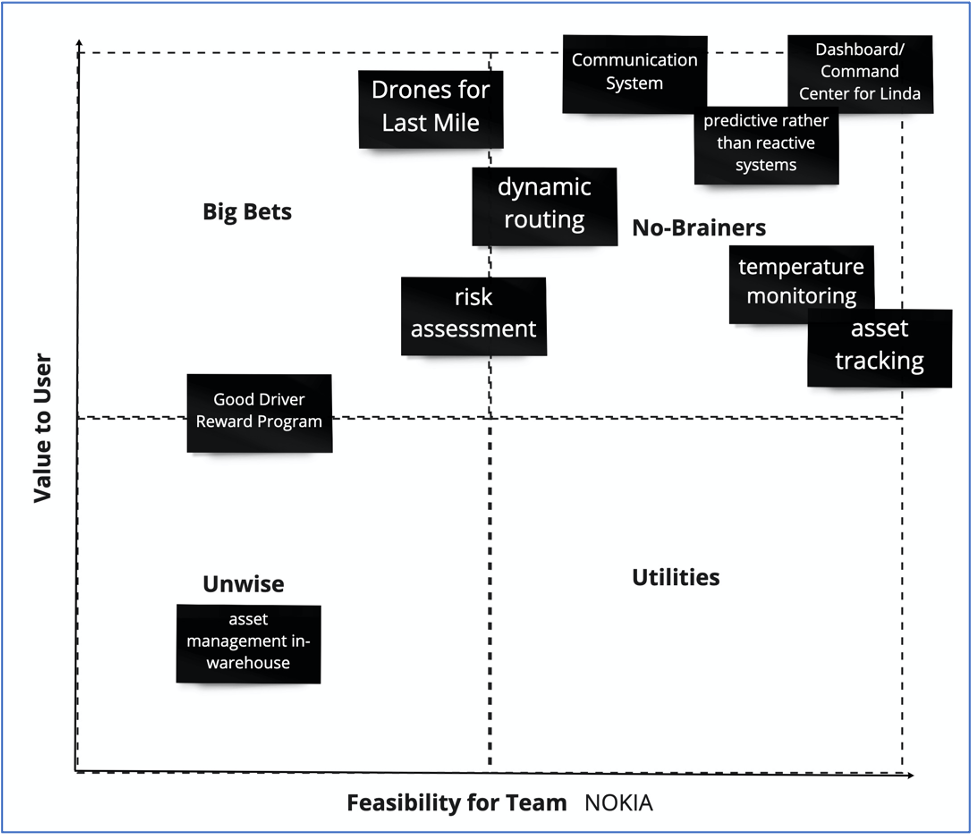
I then developed a prioritization grid, allowing the team to map each major cluster along the axes of feasibility for the team and value to the user. This helped us further prioritize which themes to focus on for our prototype.
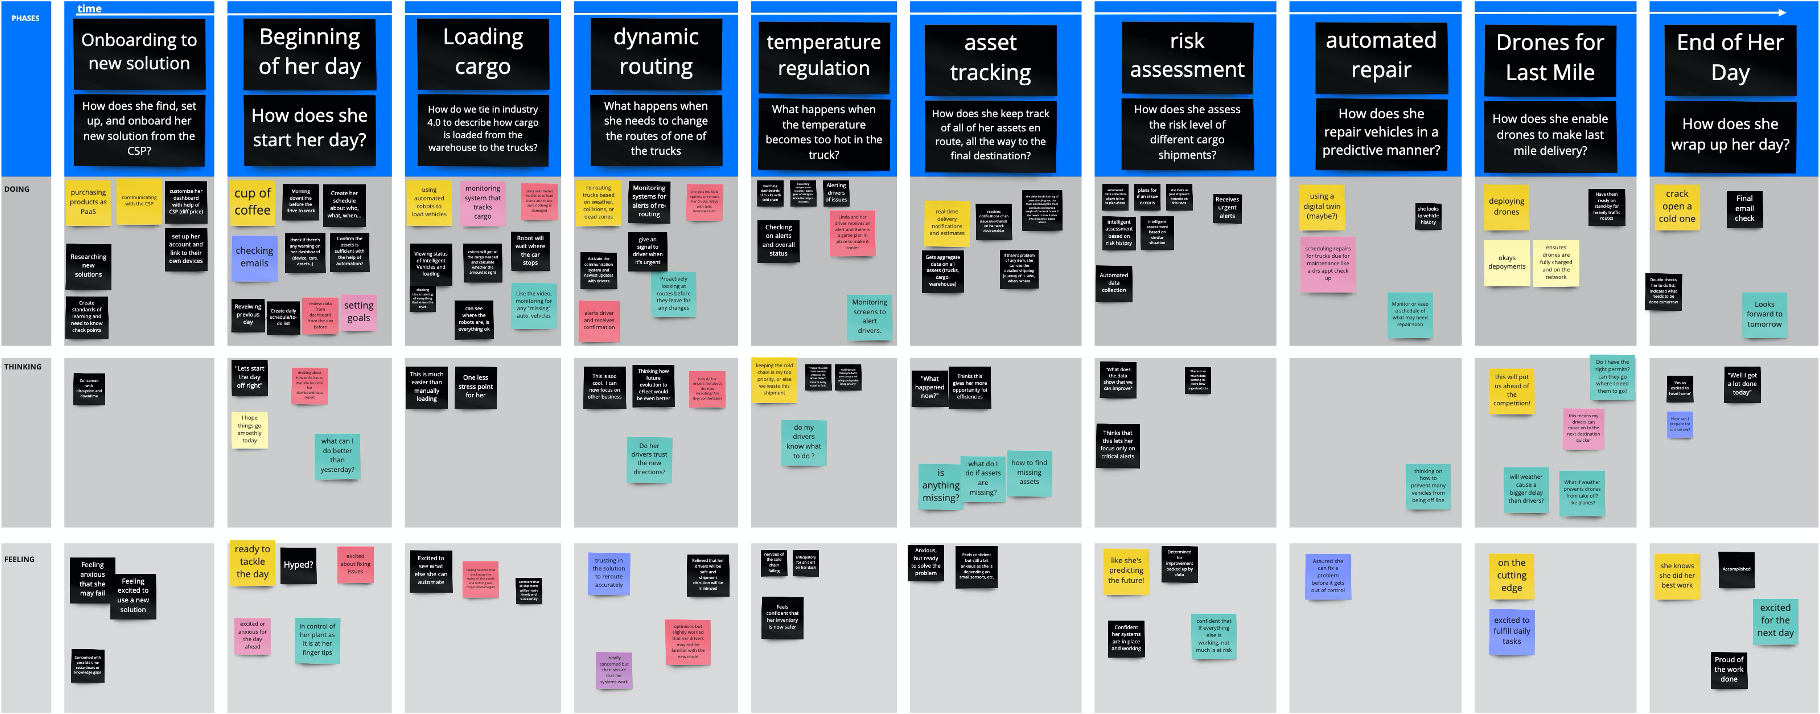
We completed another journey map, this time for the to-be scenario. Note the topmost sticky notes, which outline would become the major touchpoints of the prototype.
Just like the as-is map, I turned the to-be journey map into a storyboard to visualize Linda’s journey supported by Nokia products.
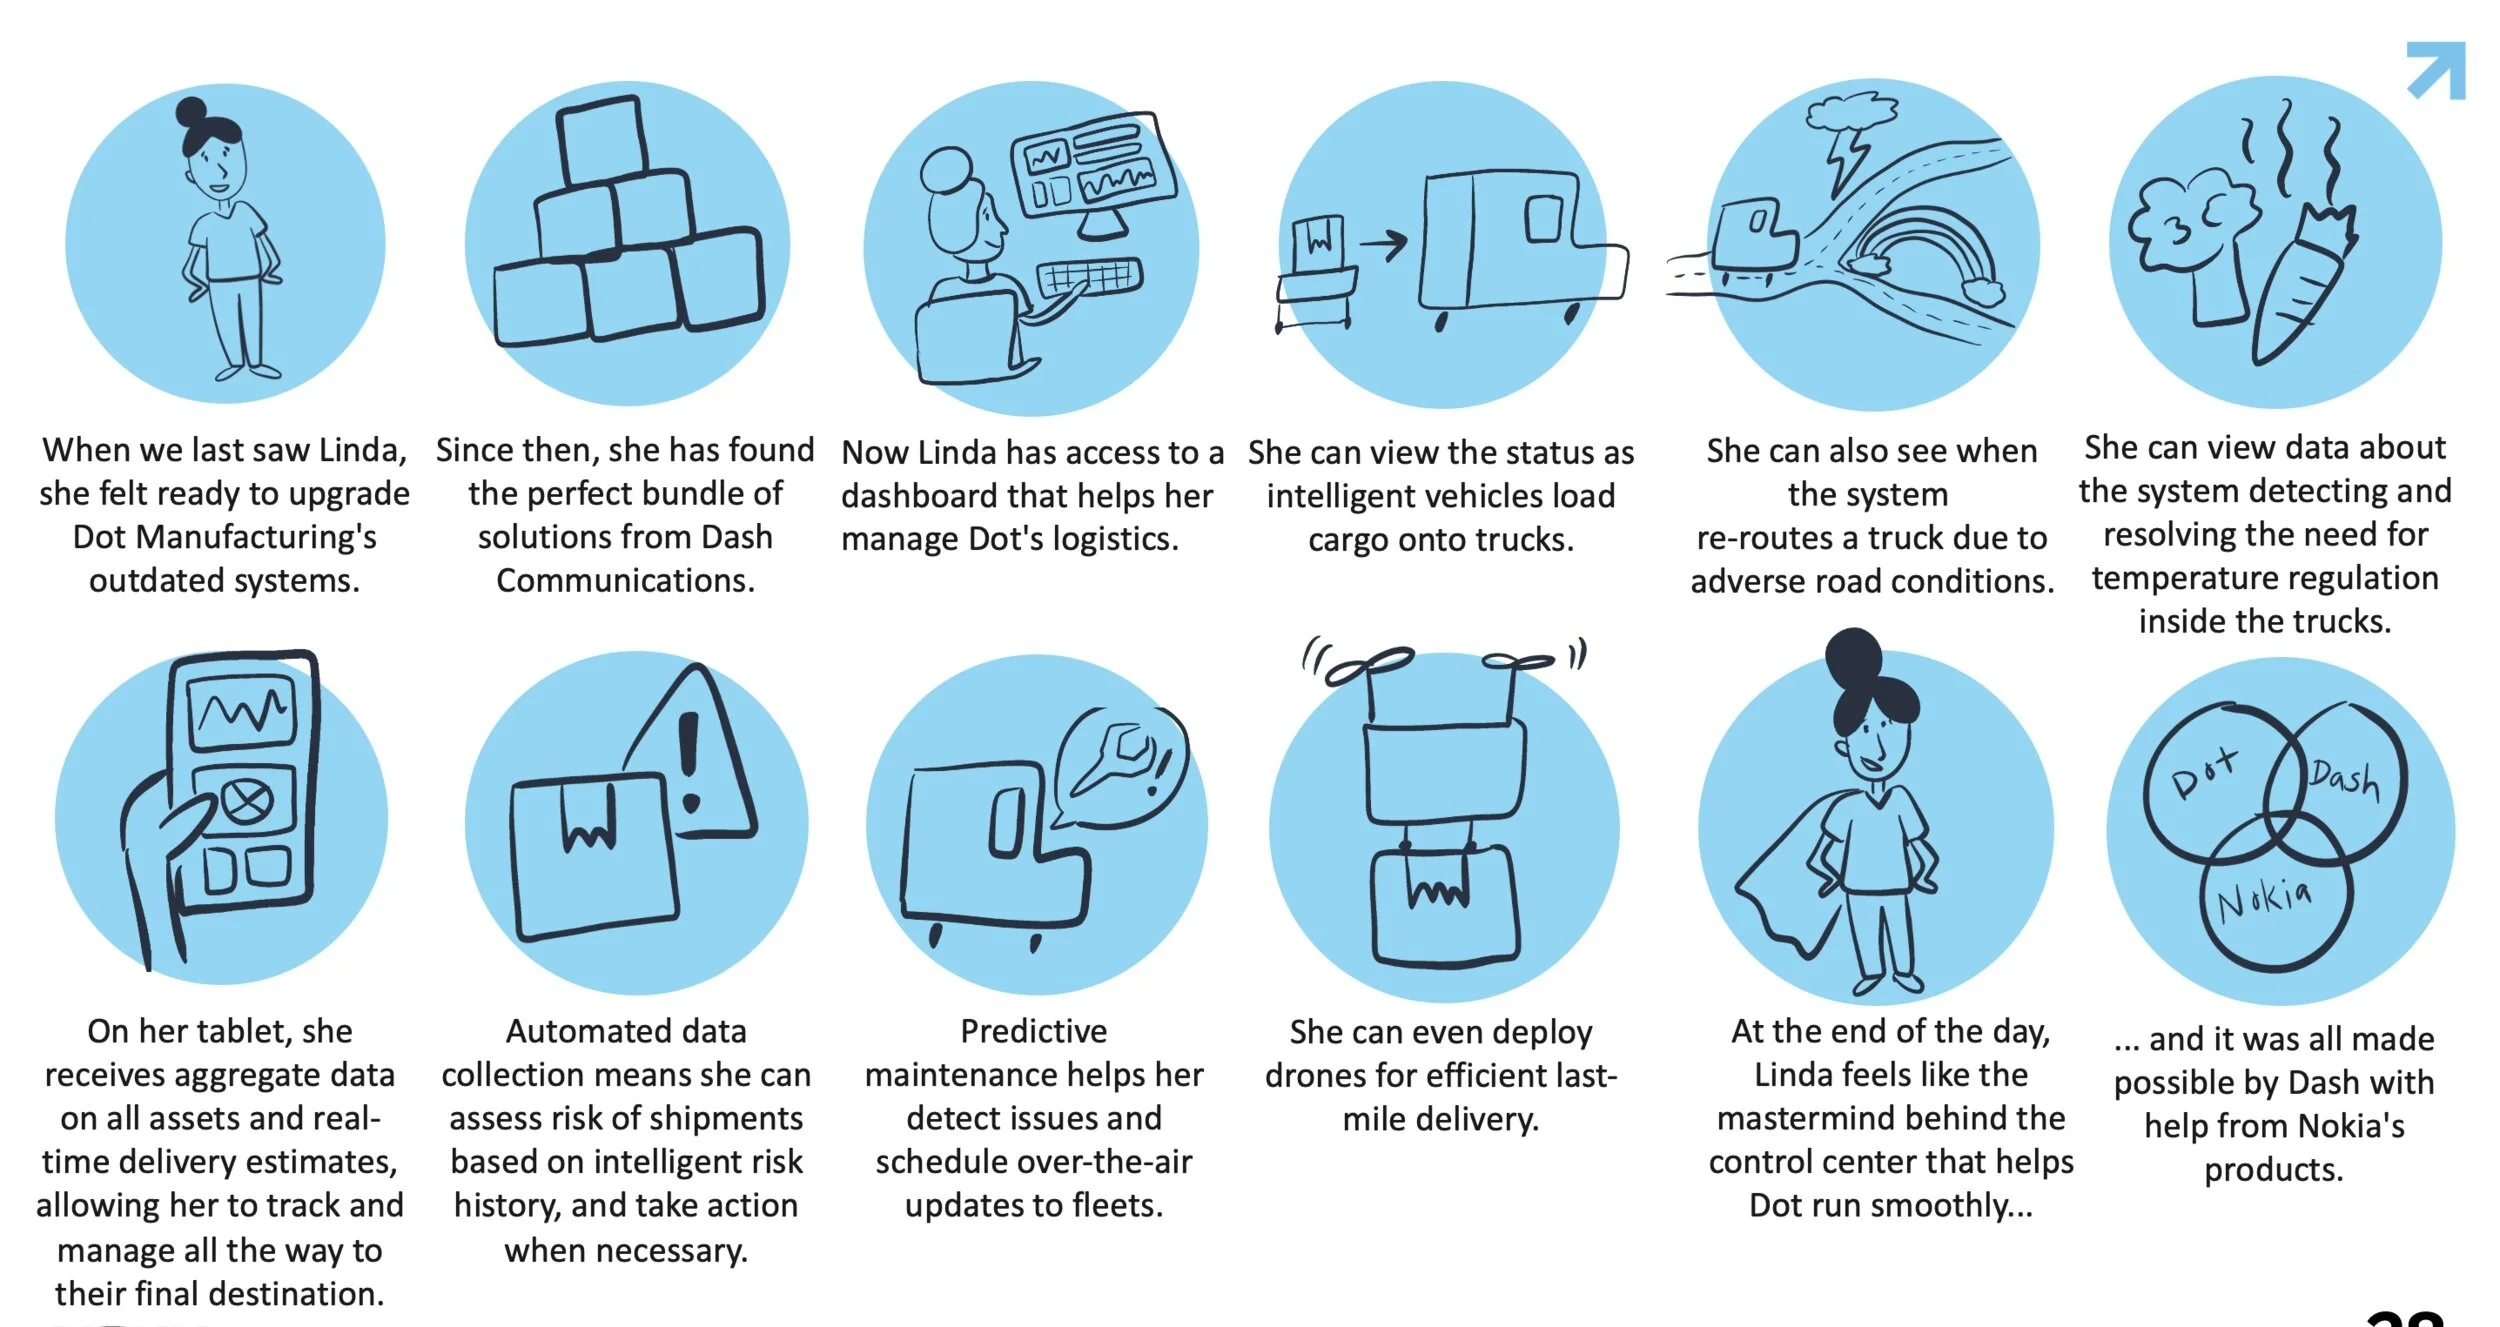
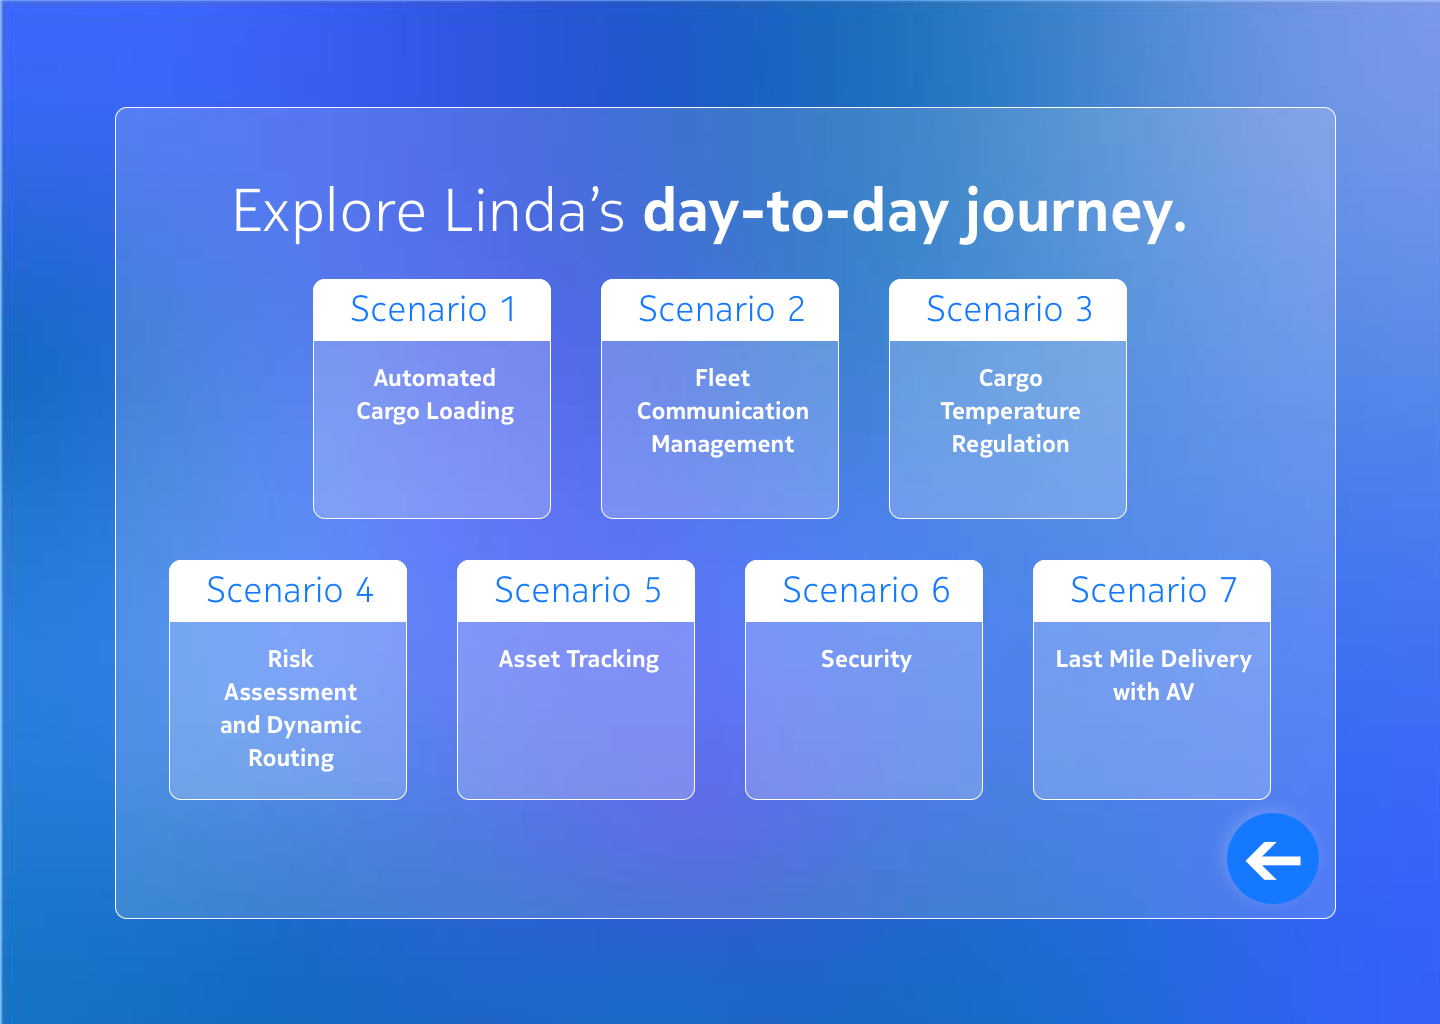
By the end of the Ideate Phase, Linda’s journey had seven major touchpoints:
Loading Cargo with Automated Intelligent Vehicles (AIVs)
Connection of smart fleet to xSIM sensors
Automatic cargo temperature regulation
Risk assessment and dynamic routing
Asset tracking
Security
Last mile delivery with AIVs
These would be the seven “micro-journeys” of the prototype that we designers would build out in the Prototyping Phase. I was personally responsible for the design of journeys 3 and 4.
Prototype
In this project, the team wanted to revamp the way we handled prototyping. Our old process was chaotic, unorganized, and unreliable.
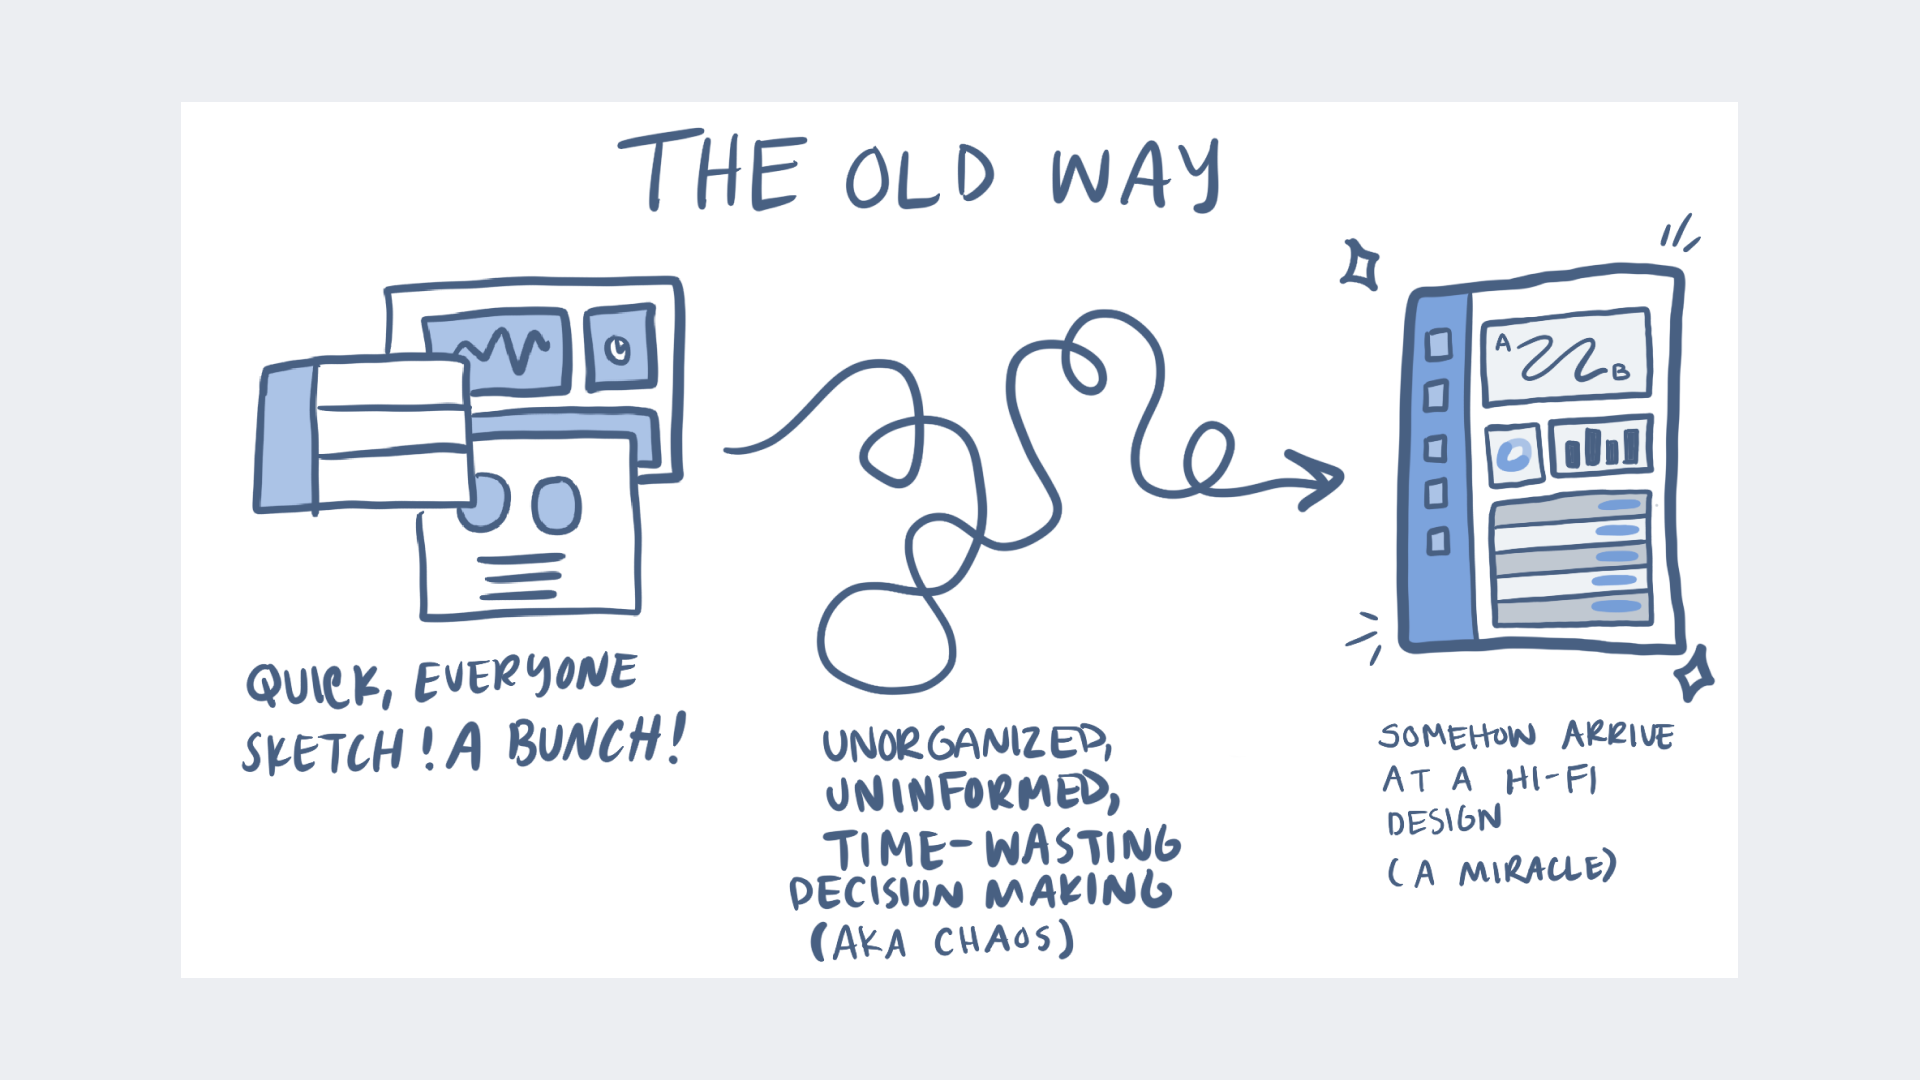
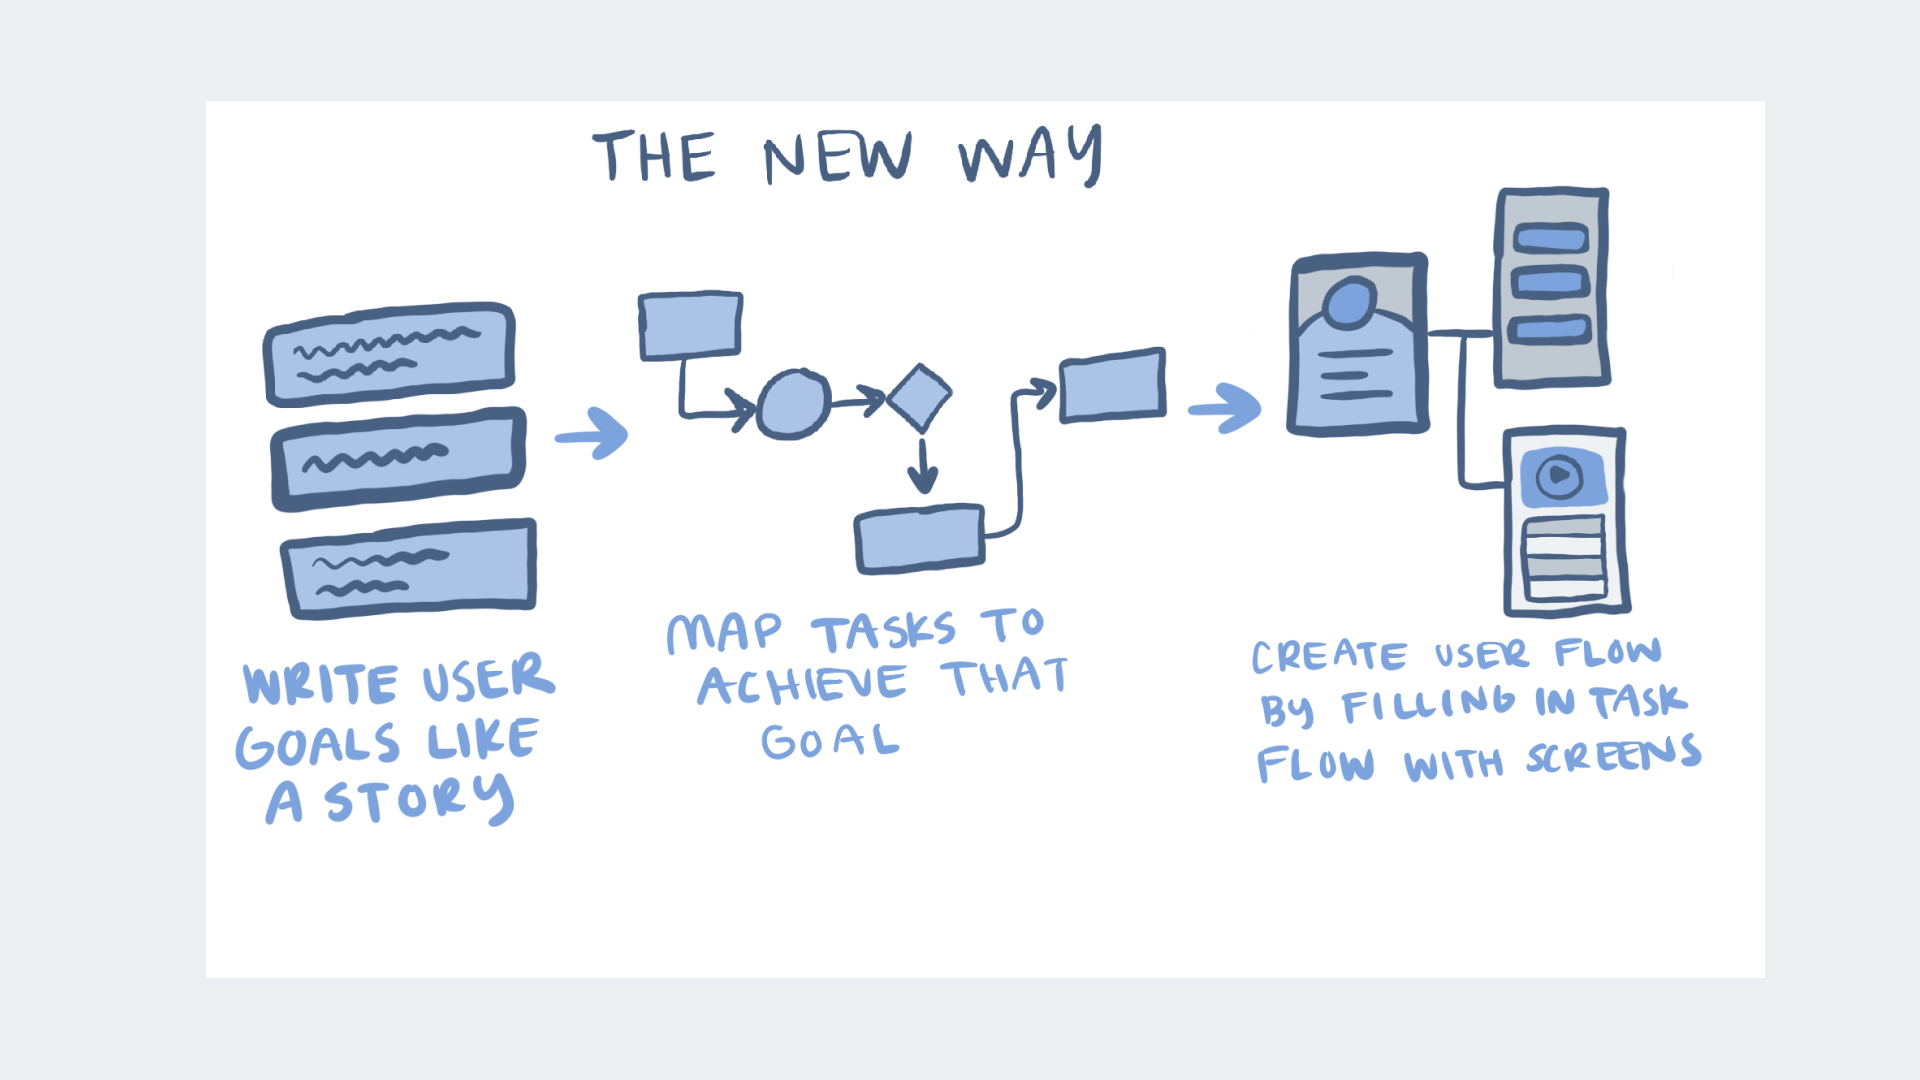
Myself and the design interns decided to adopt a prototyping process that started with writing rather than sketching.
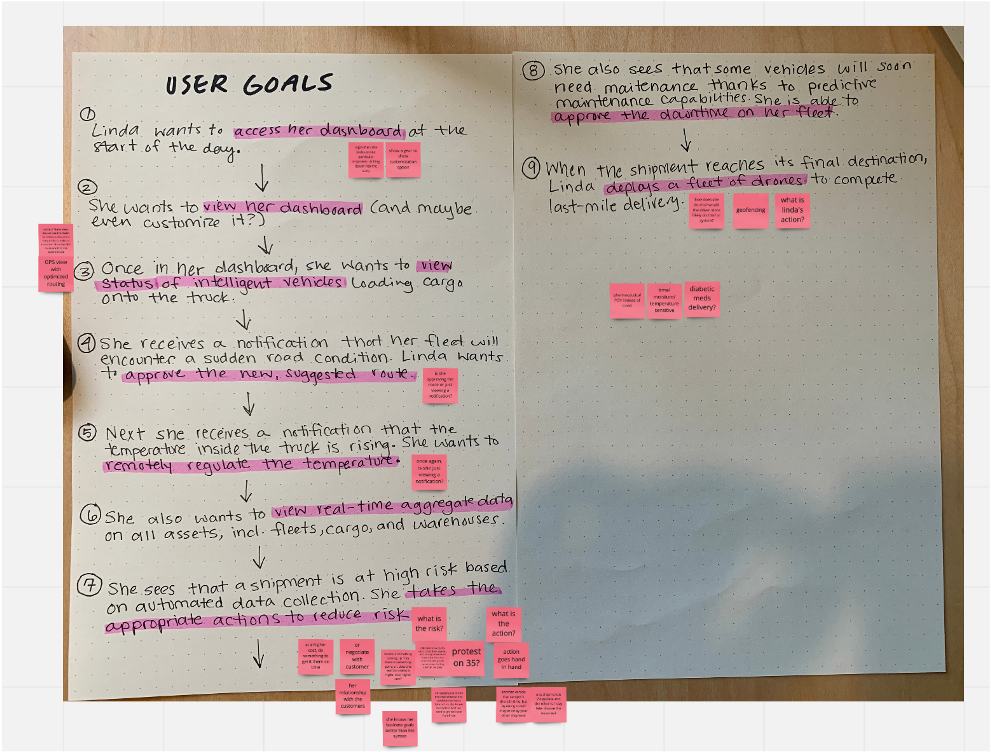
Below, you can see my user stories, with highlighted interaction touchpoints.
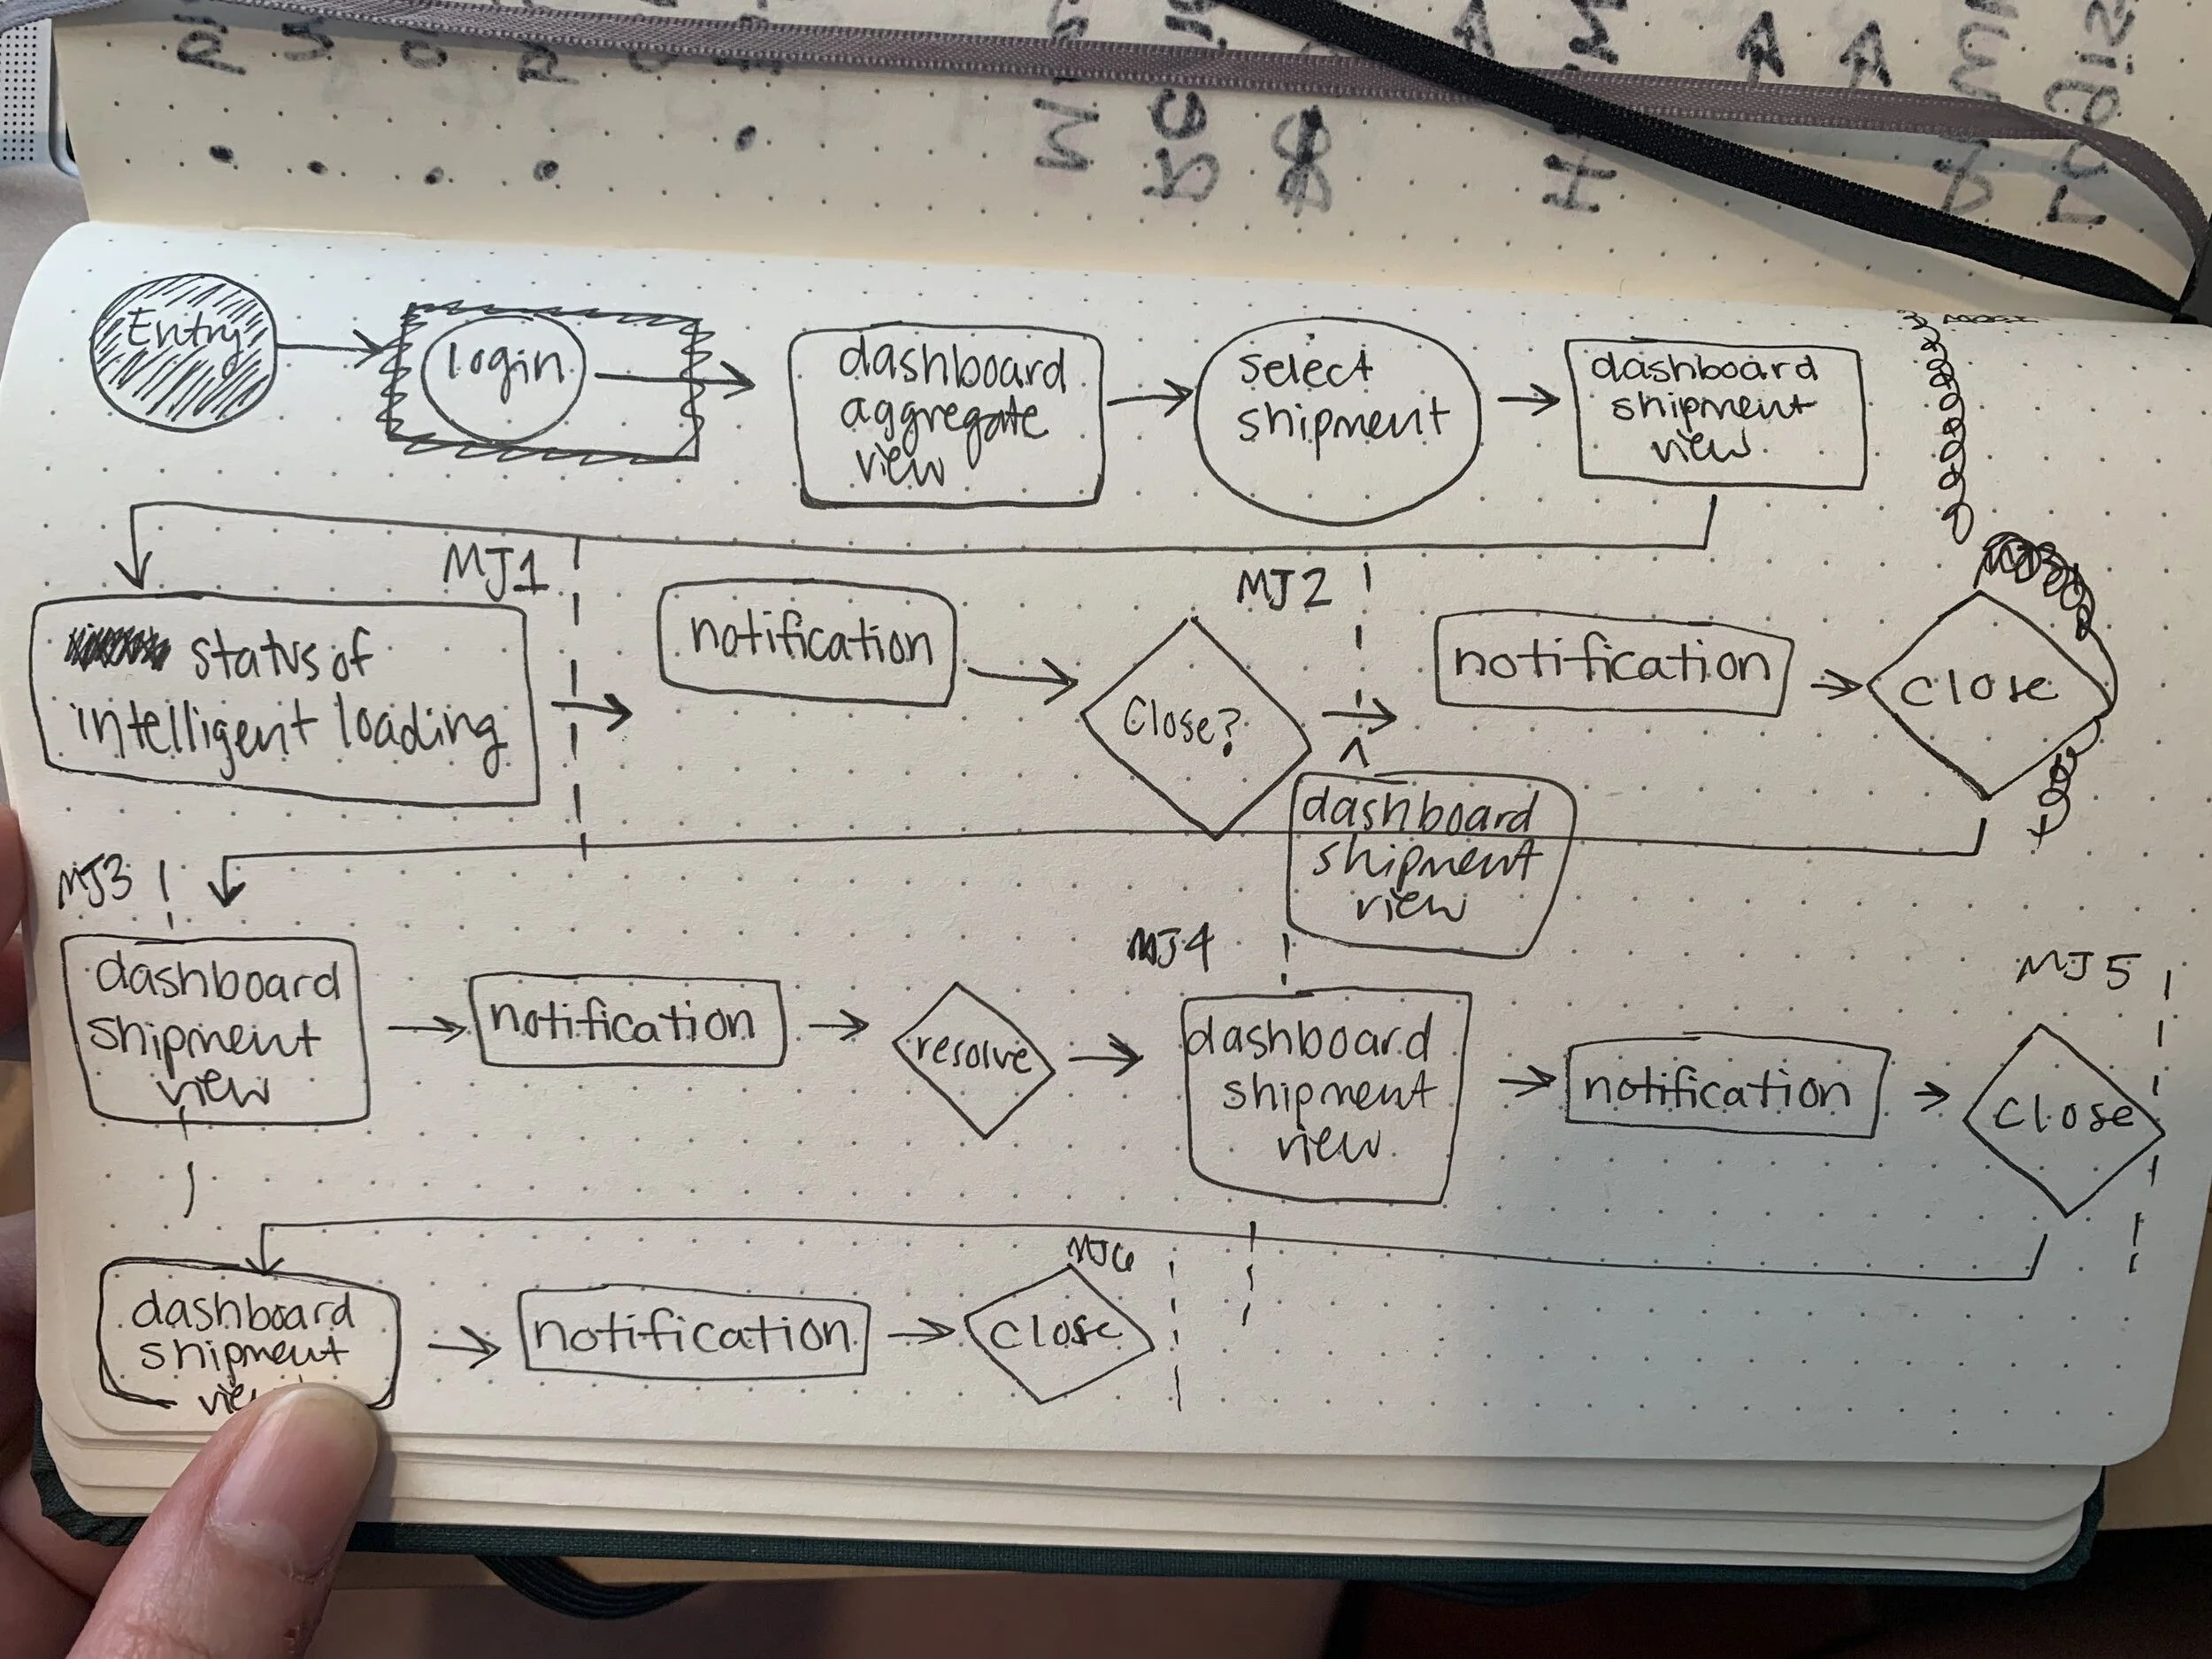
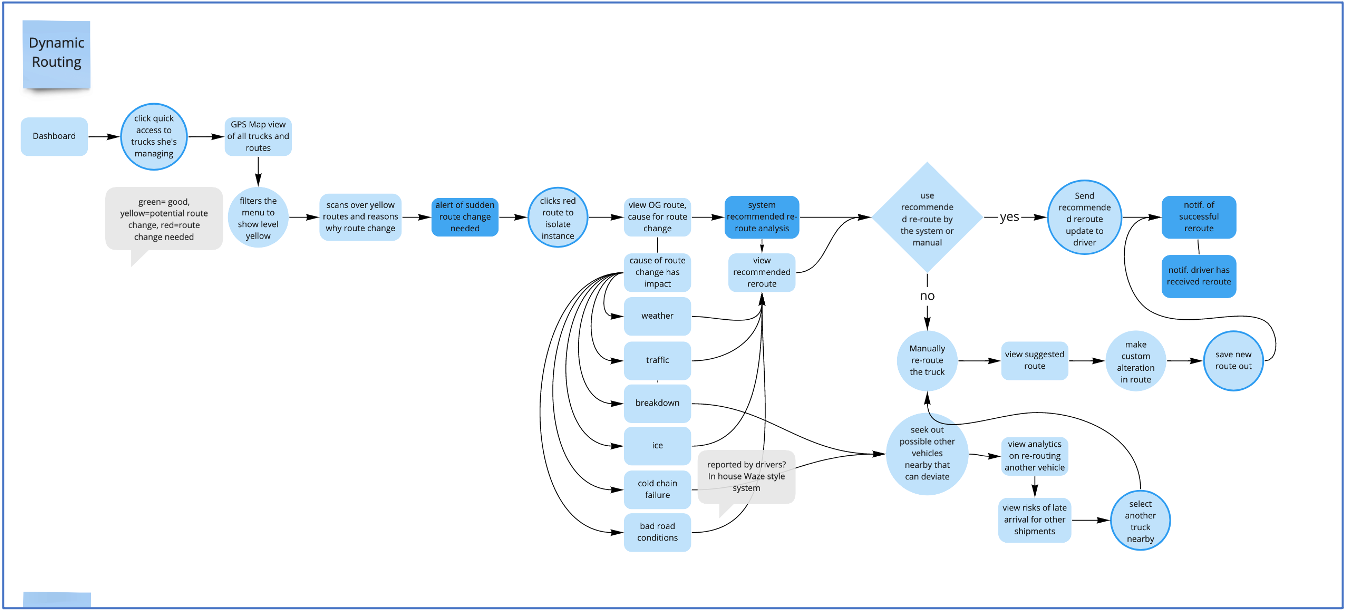
Next, we assembled goal-based task flows. On the left, you see an early iteration of a high-level task flow for the entire journey, and on the right is an iteration of a task flow for a single touchpoint in the journey.
As we moved into low-fidelity paper sketches, myself and the design interns filled in pieces of the task flow with our interpretations of what each screen would look like.
This new process allowed us to have more informed, directed conversations about what to include on each screen, rather than the aimless sketching that came from our previous prototyping process.
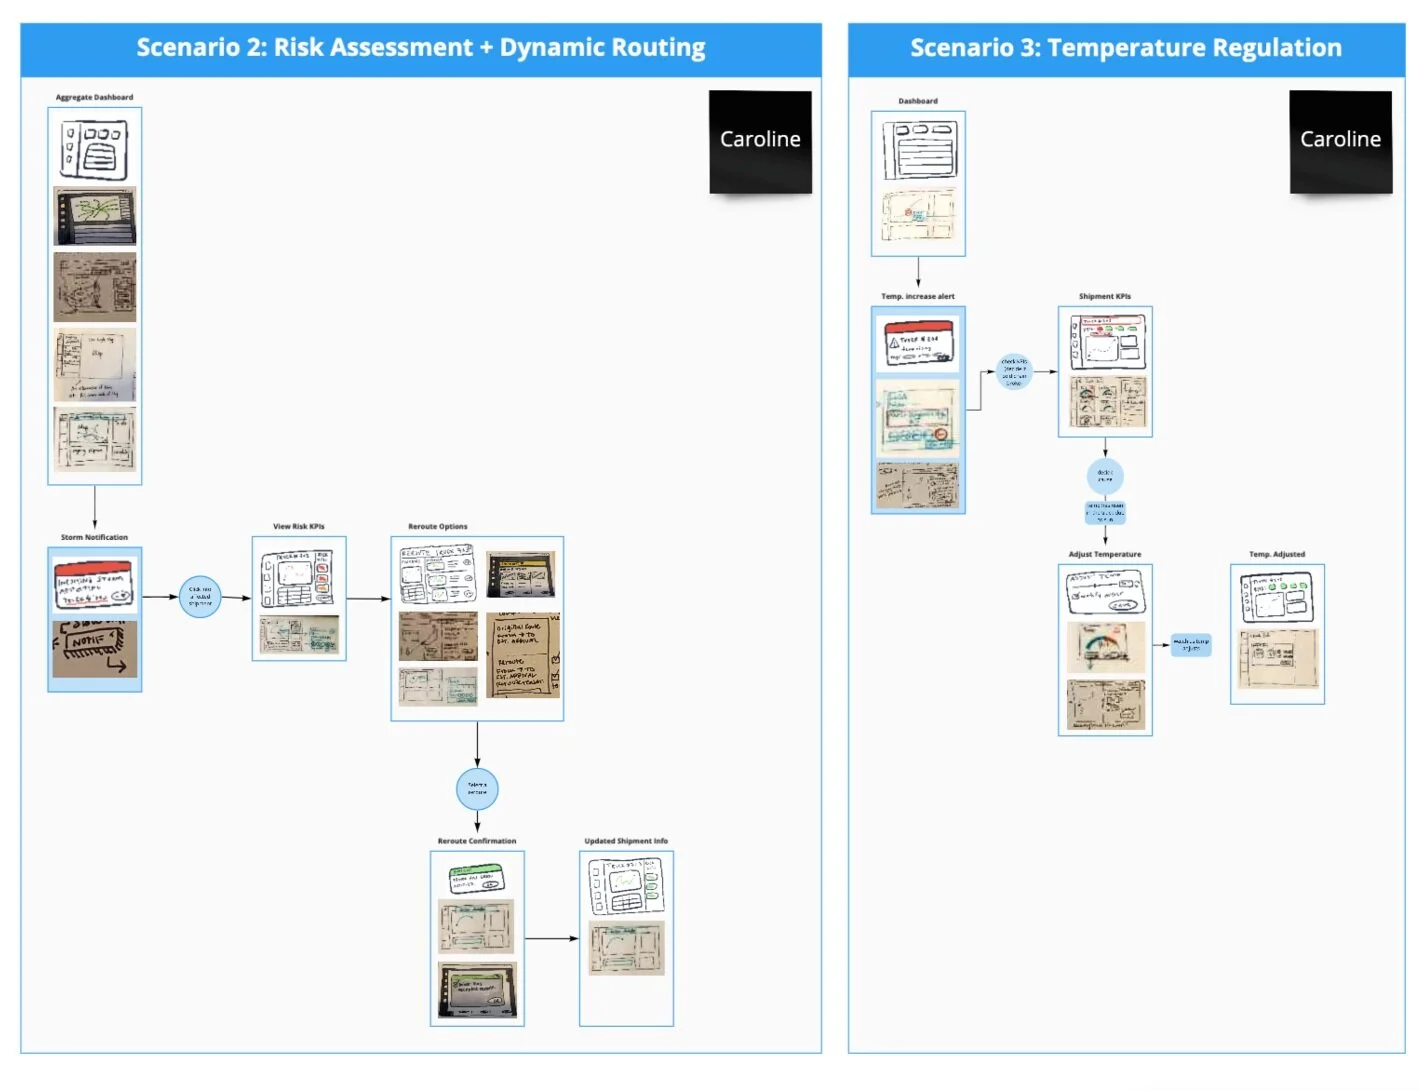
After critical UI decisions were made about each screen, the designer assigned to each journey touchpoint would take the sketches to mid- and high-fidelity, filling in the task flow with each iteration. Aside from helping us stay organized, an additional benefit of this method was that our director could take the task flow Miro document to stakeholders to get validation as we designed each screen, and he wasn’t required to endure the learning curve of navigating the Sketch document to do so.
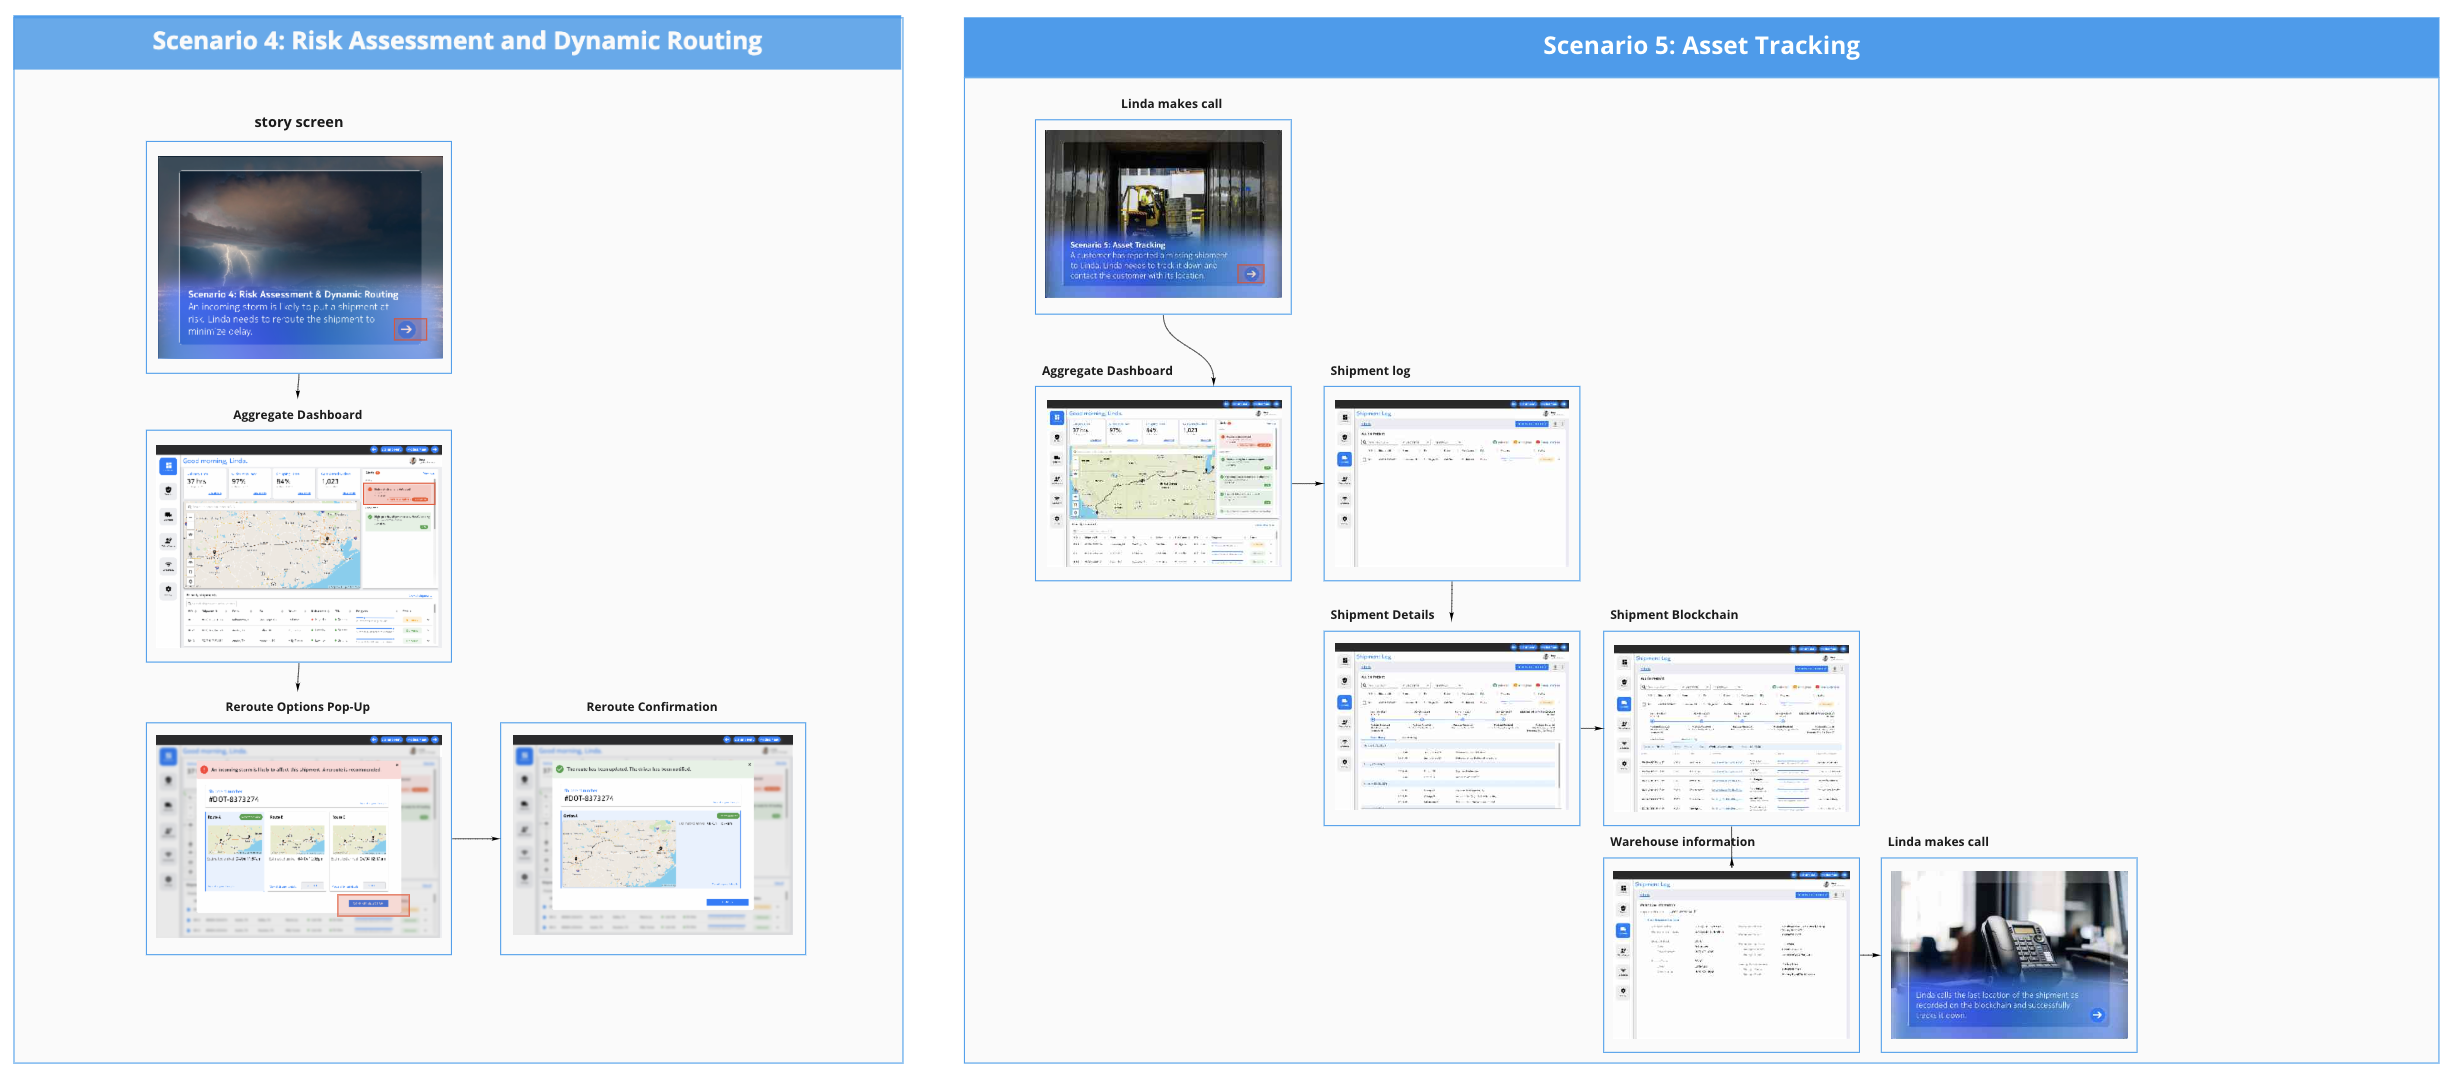
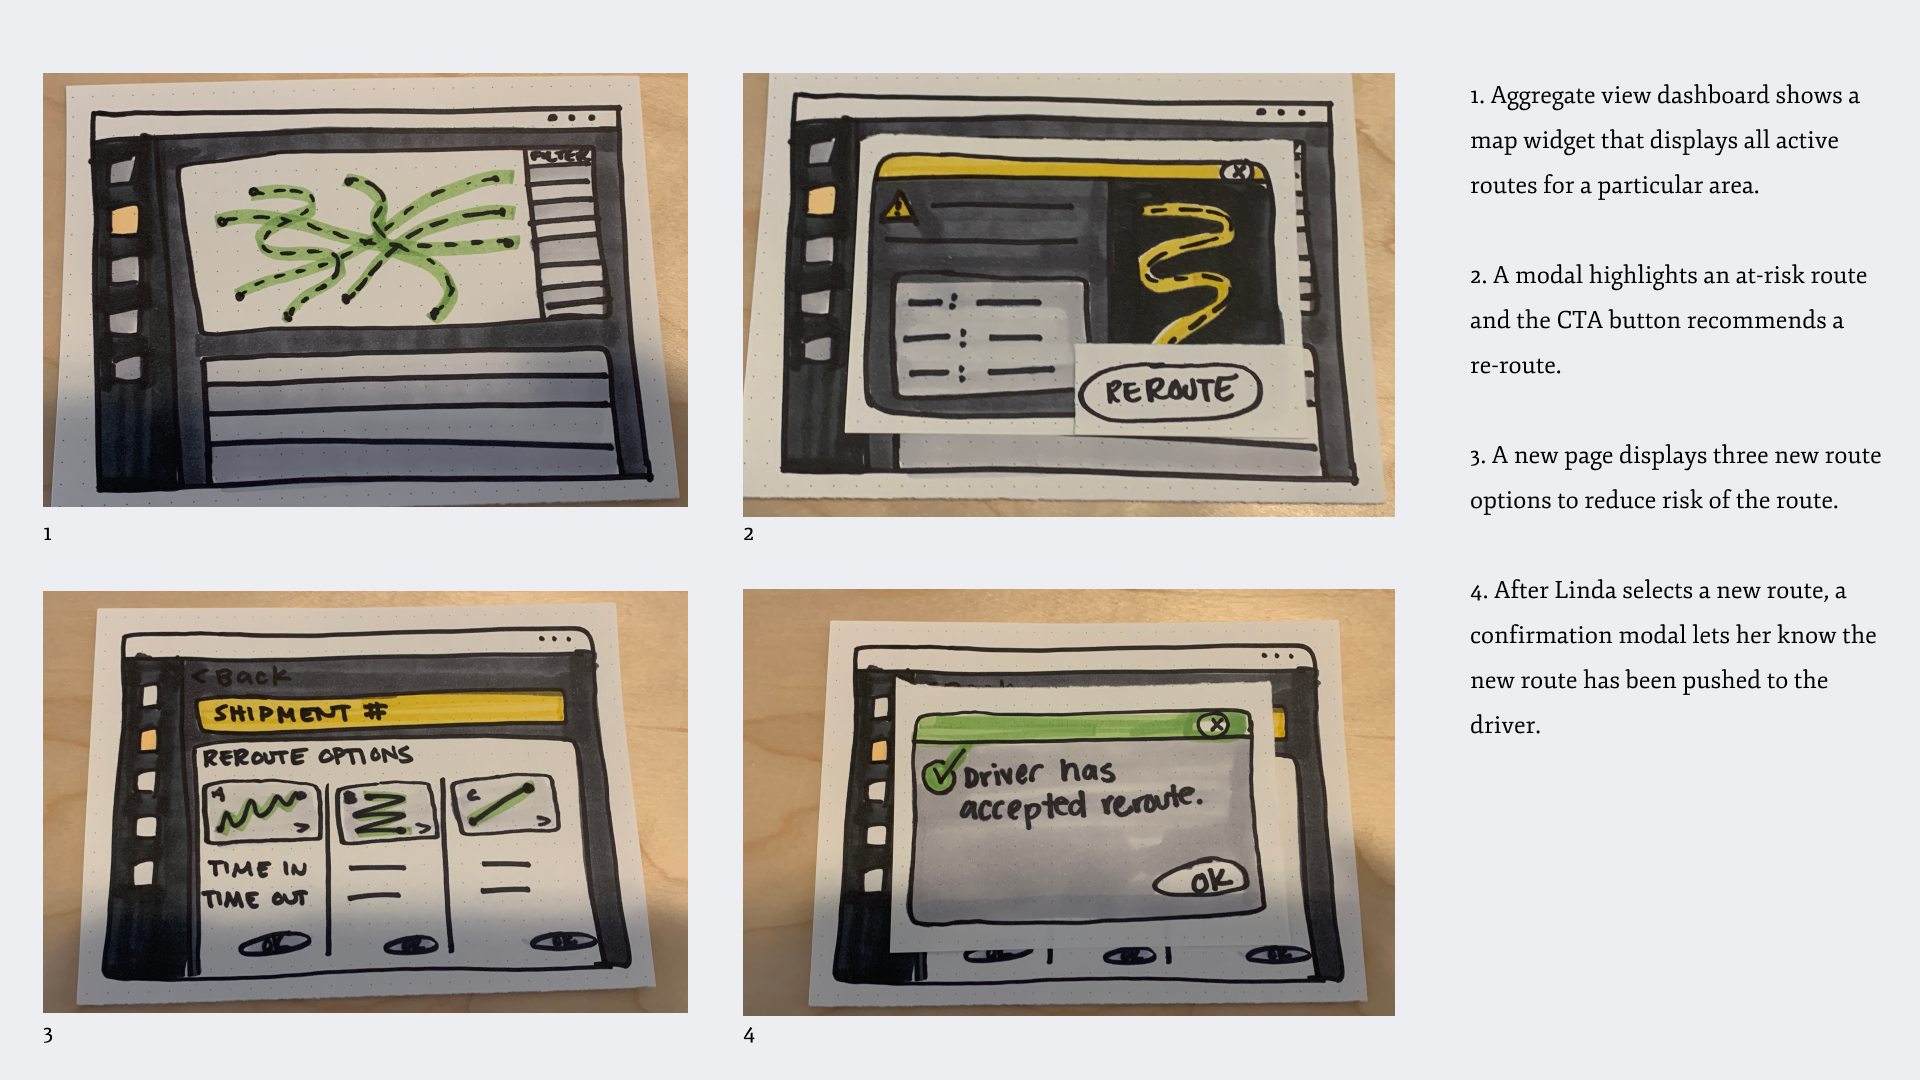
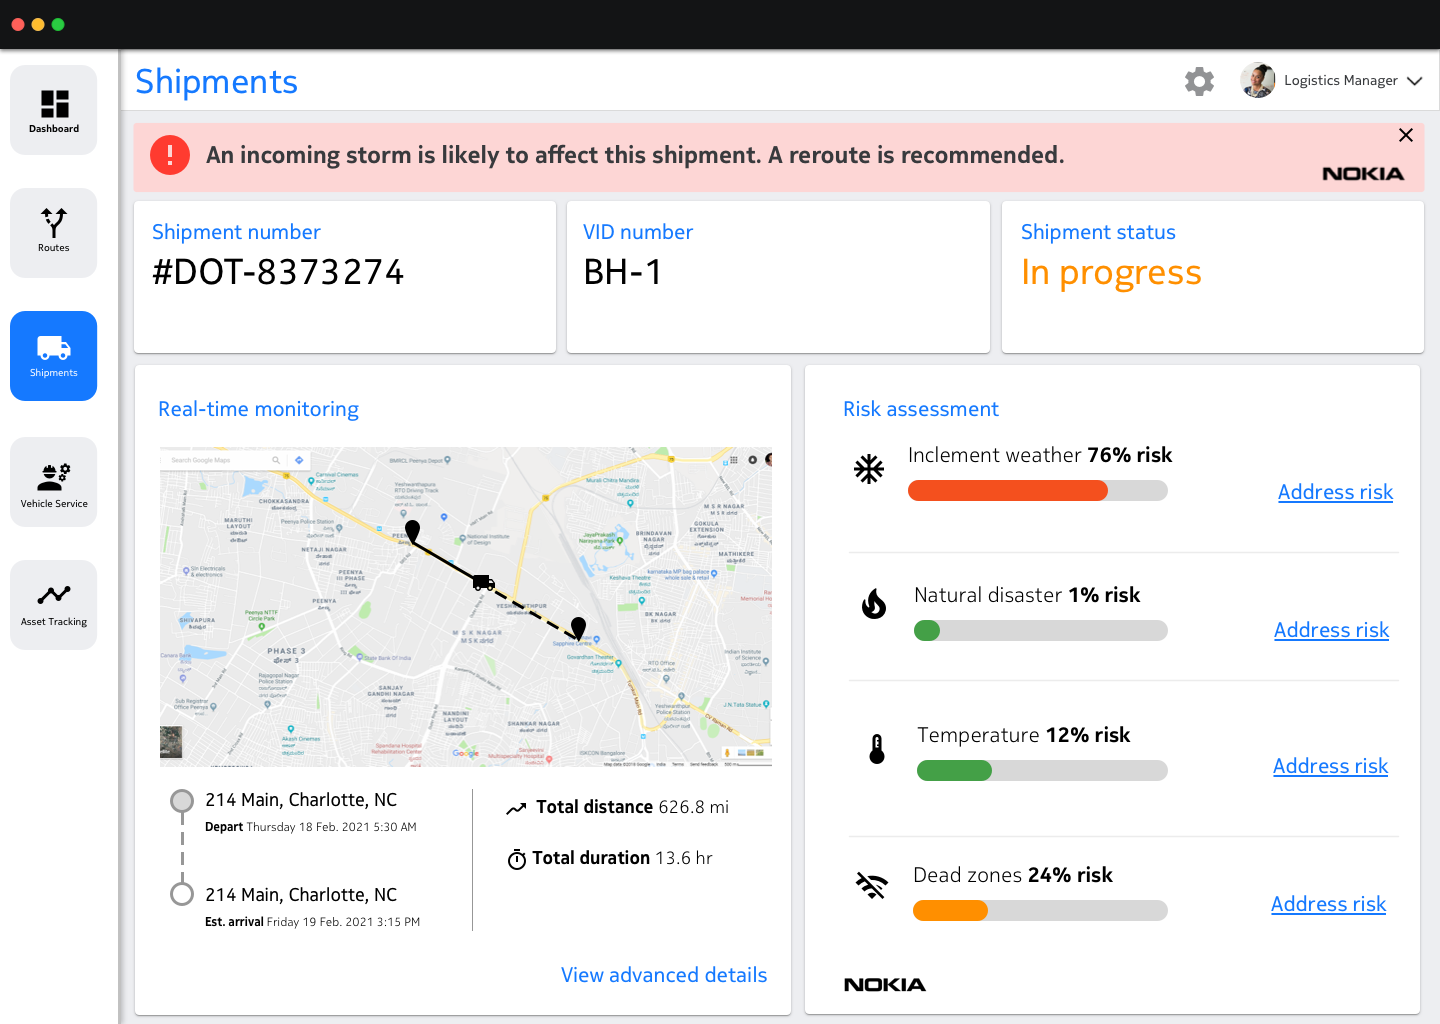
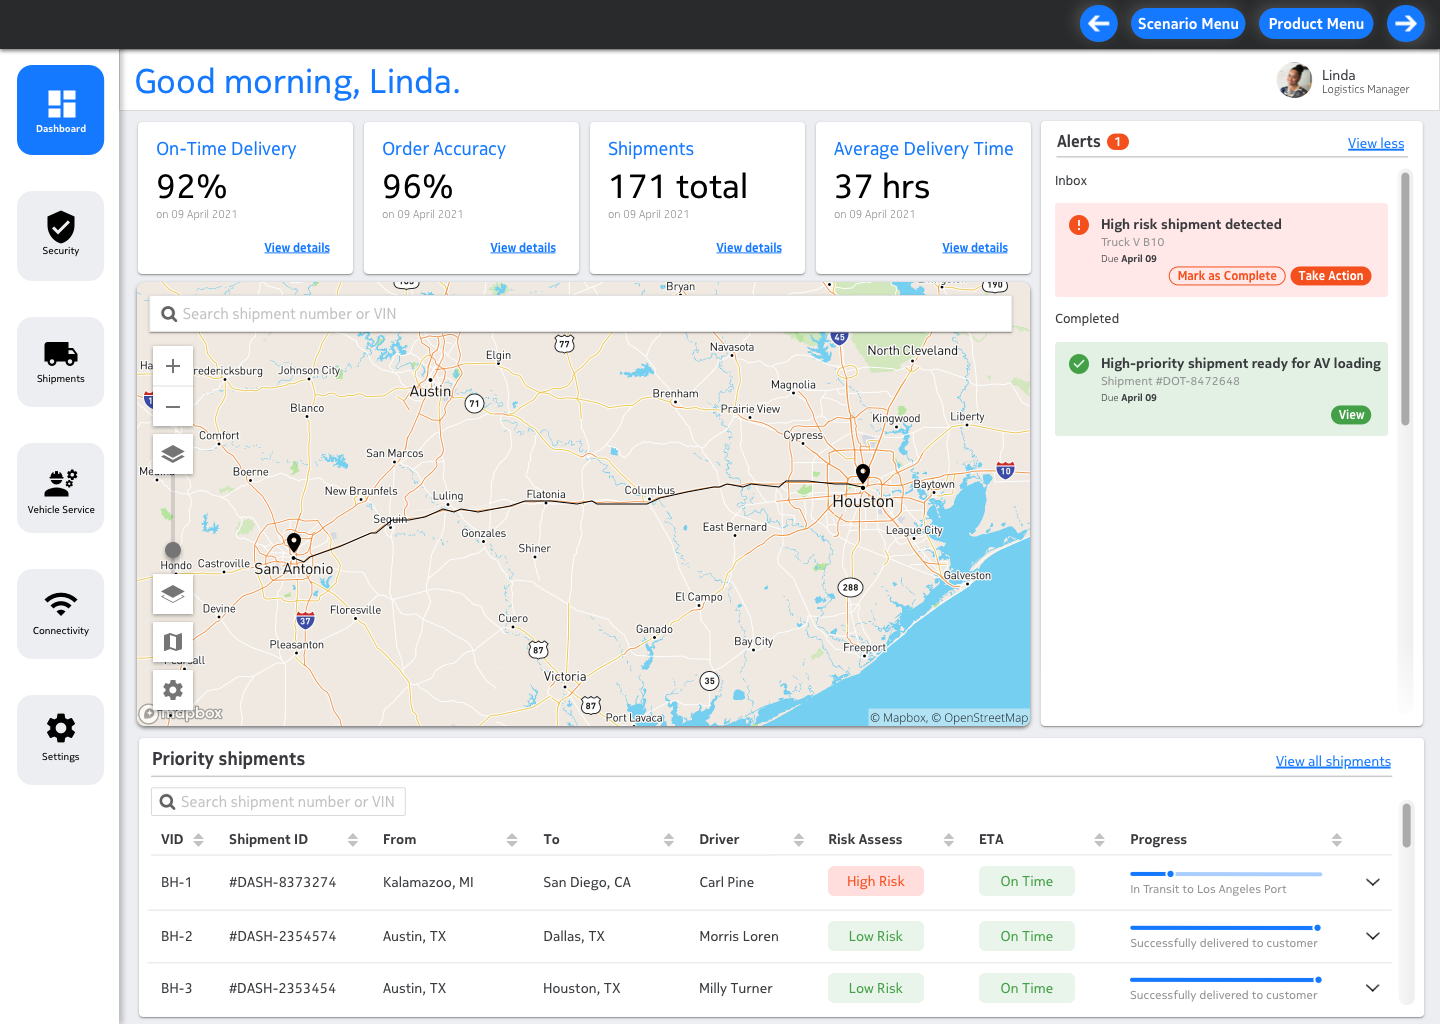
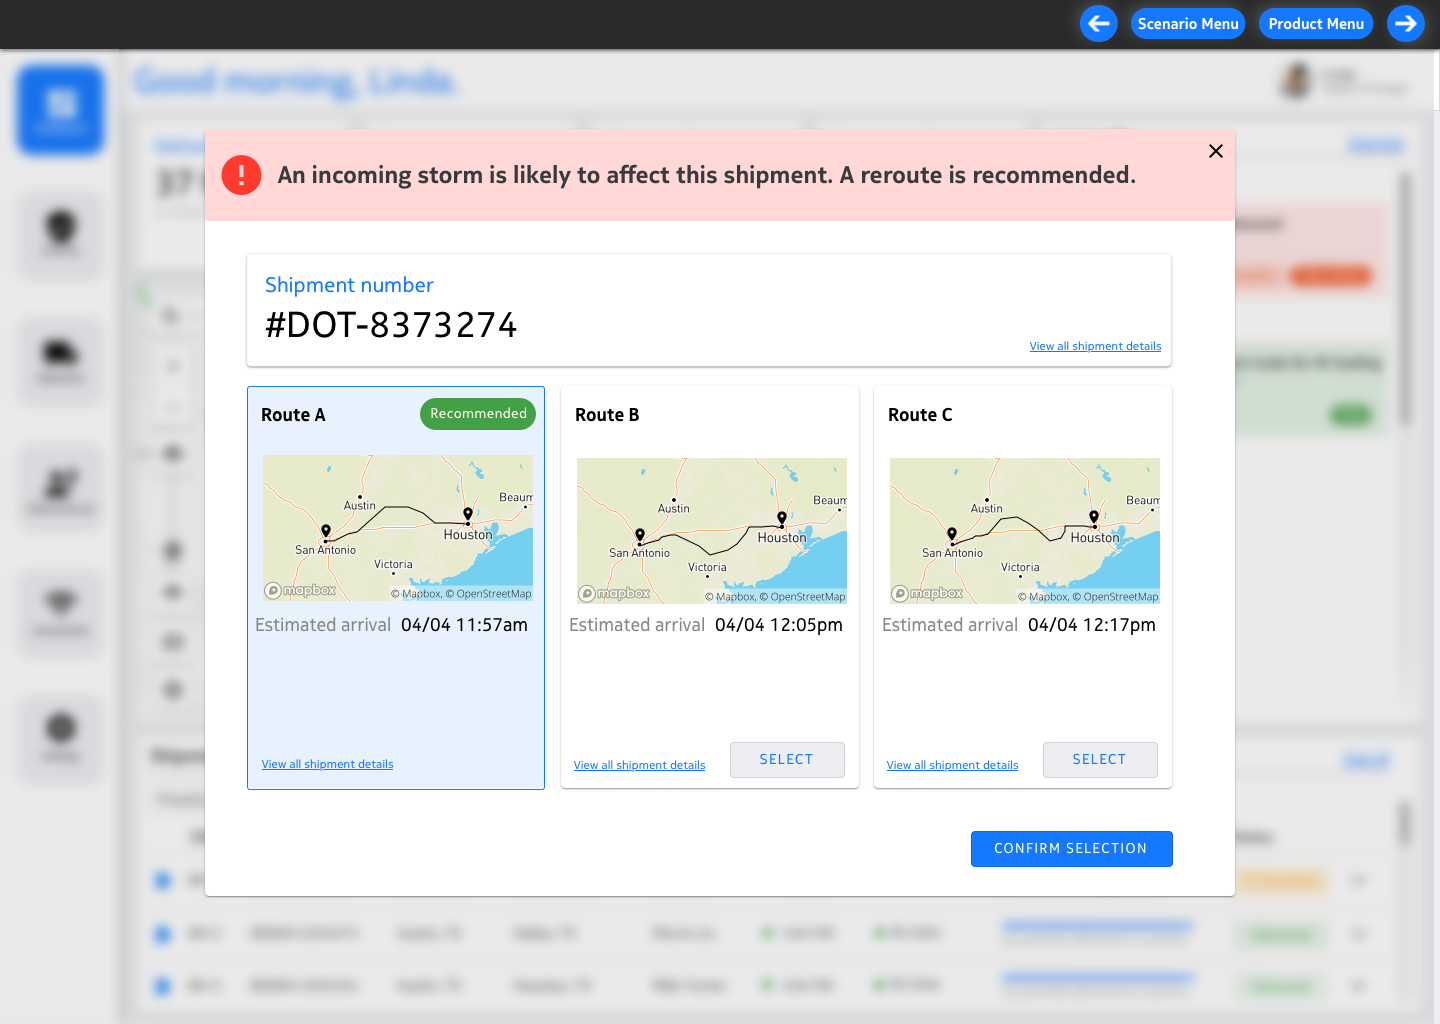
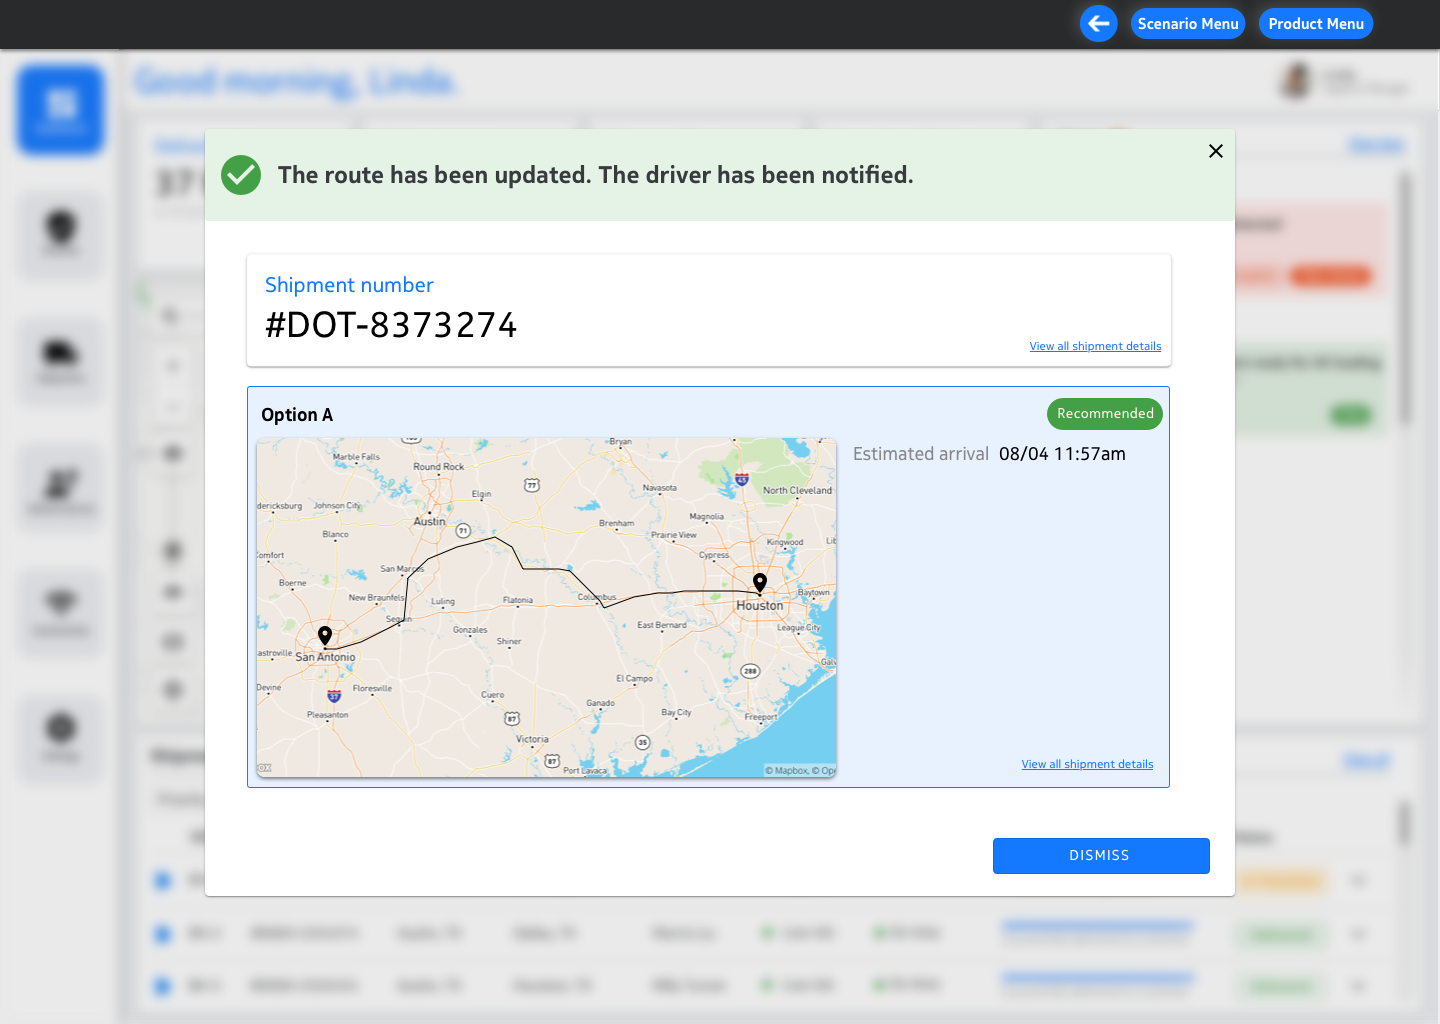
Backing up, let’s look at my low-, mid-, and high-fidelity prototyping process for one of my journey touchpoints, risk assessment and dynamic routing. In this scenario, Linda is notified of an at-risk shipment (the risk being poor weather or bad traffic) and must select a new route and push it to the truck driver.
My low-fidelity process includes sketching on gridded paper with Copic markers and Sharpies, layering pieces of paper over each other to represent modals and important buttons. In this phase, I only include crucial copy and work in greyscale unless the addition of color adds value to the sketch, like in the below sketches where color indicates the risk status of a route.
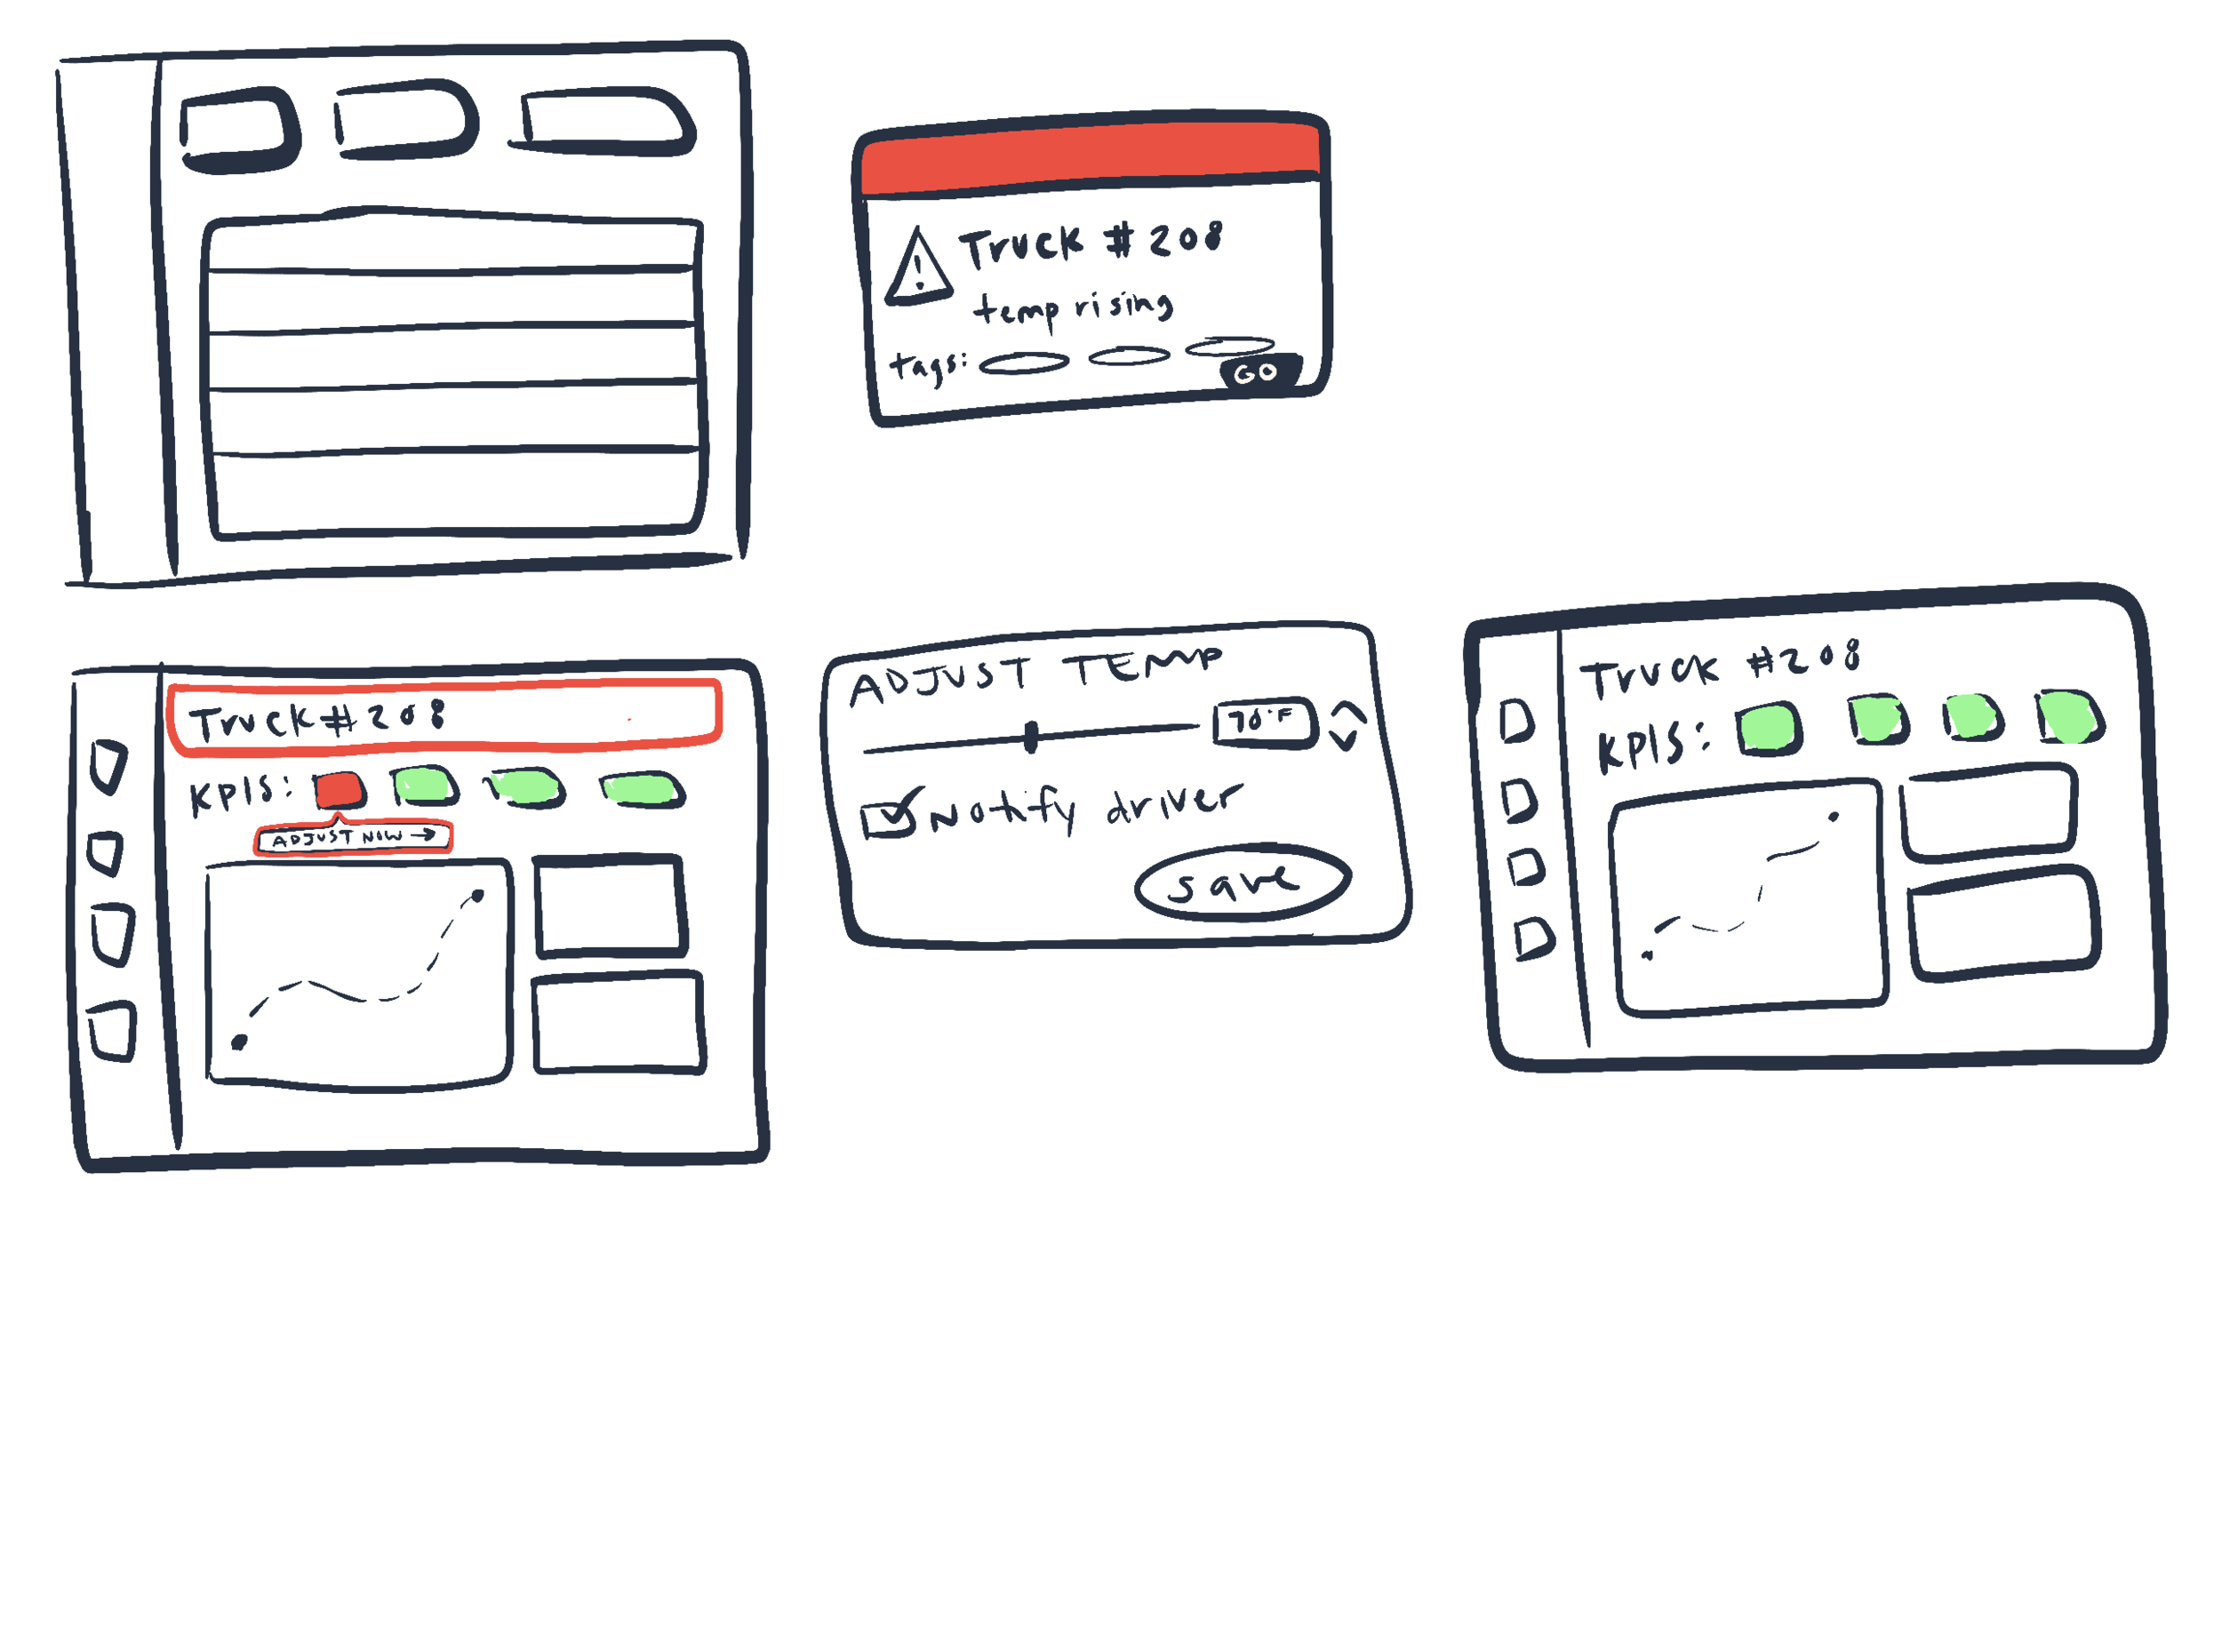
I also sometimes refine my low-fidelity sketches in Procreate once I’ve decided on an iteration. The sketches below are low-fidelity sketches for another journey touchpoint I designed, concerning automatic temperature regulation.
Going back to my risk assessment and dynamic routing touchpoint, below you see the mid-fidelity sequence I designed. Major issues with this iteration include spacing/white space issues on the main dashboard, as well as poor color choices for the status colors. These issues would be resolved in the high-fidelity versions.
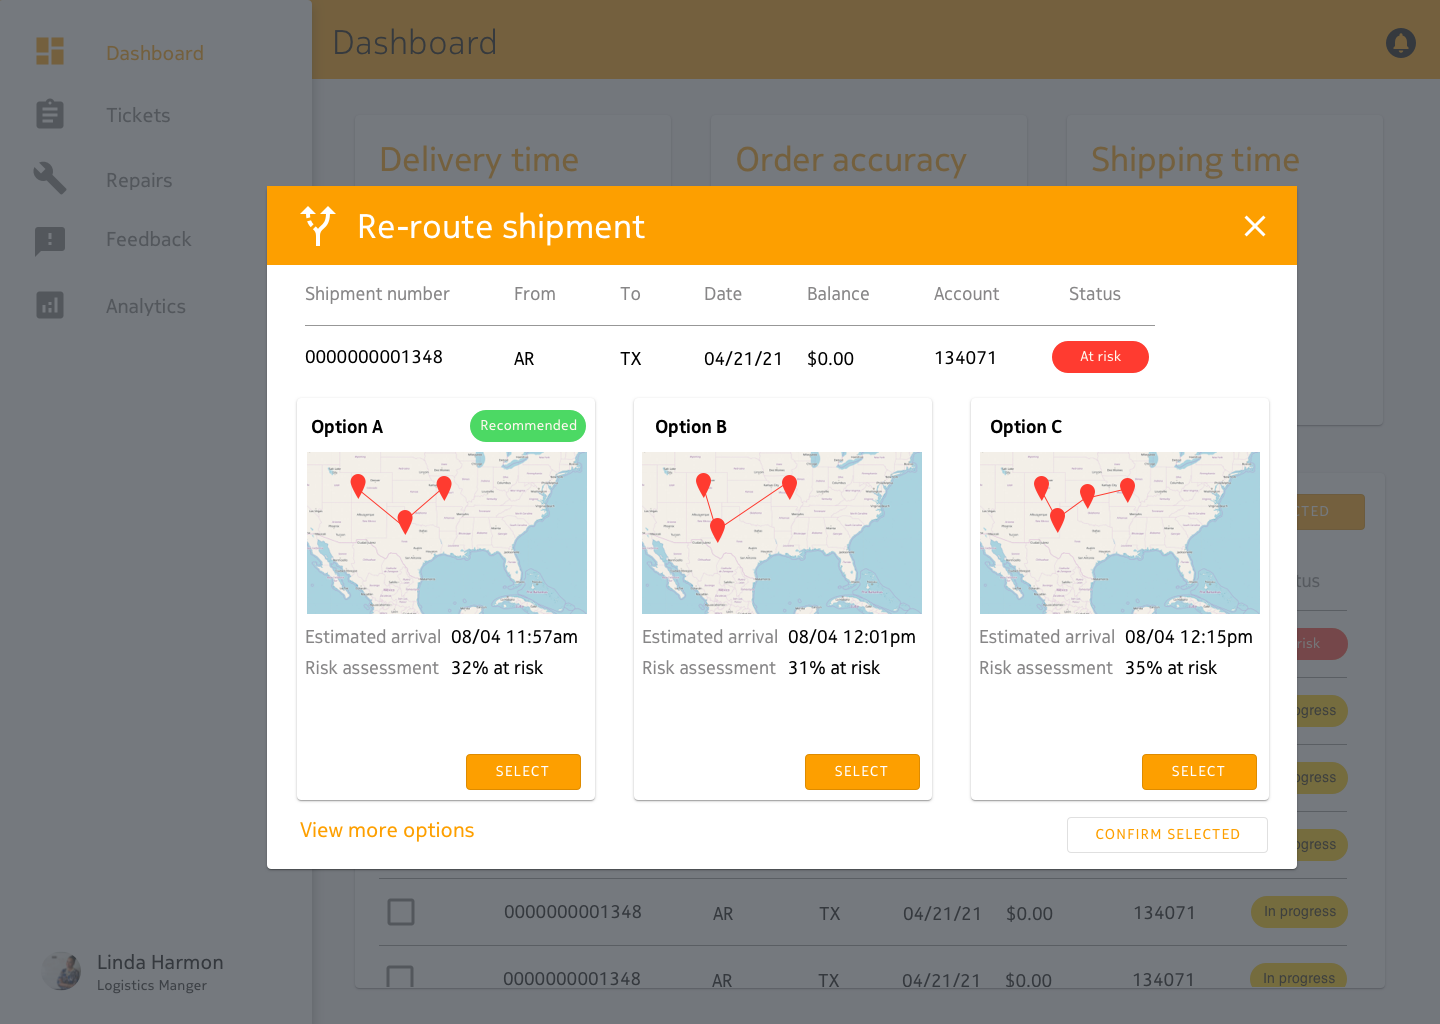
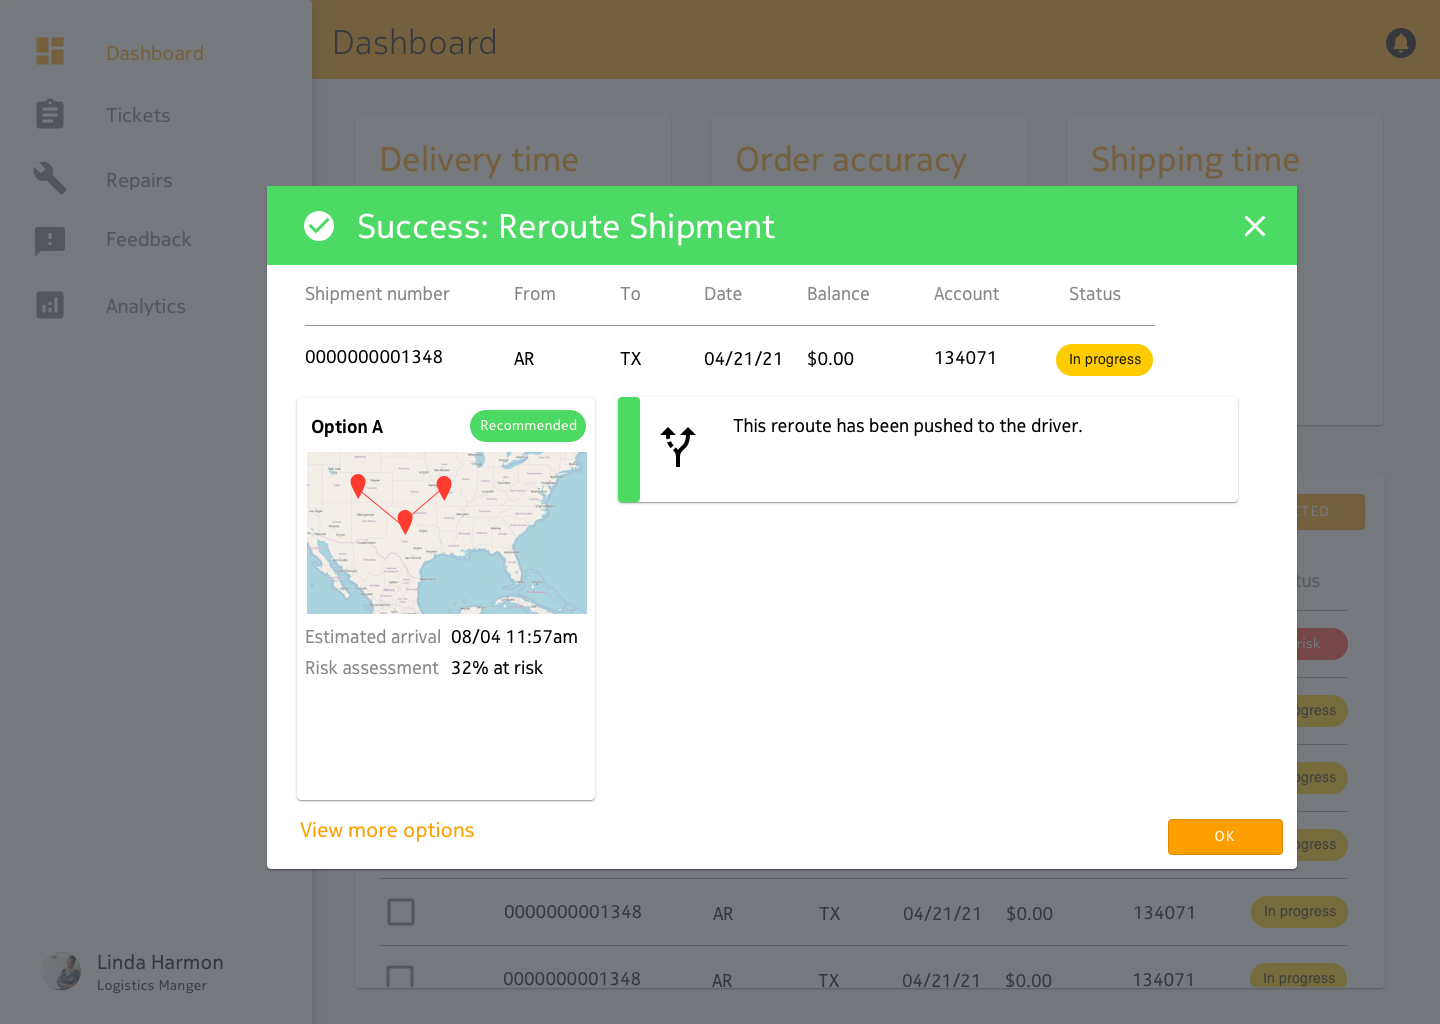
I then took the prototype into high-fidelity, where you can see greater refinement of UI elements and how I addressed the issues stated above.
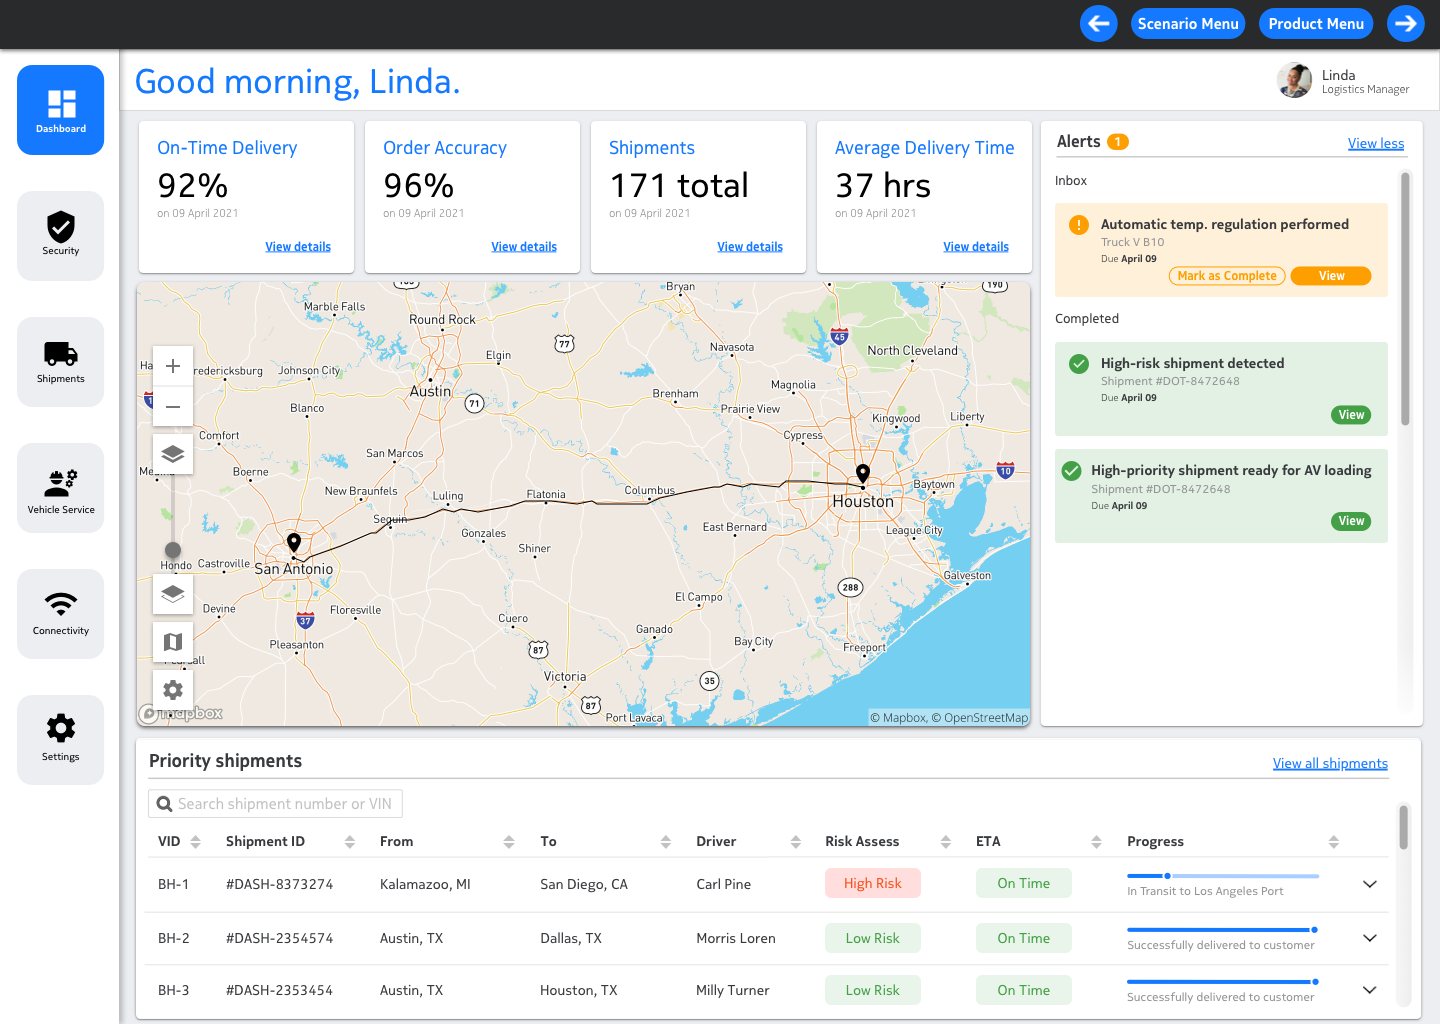
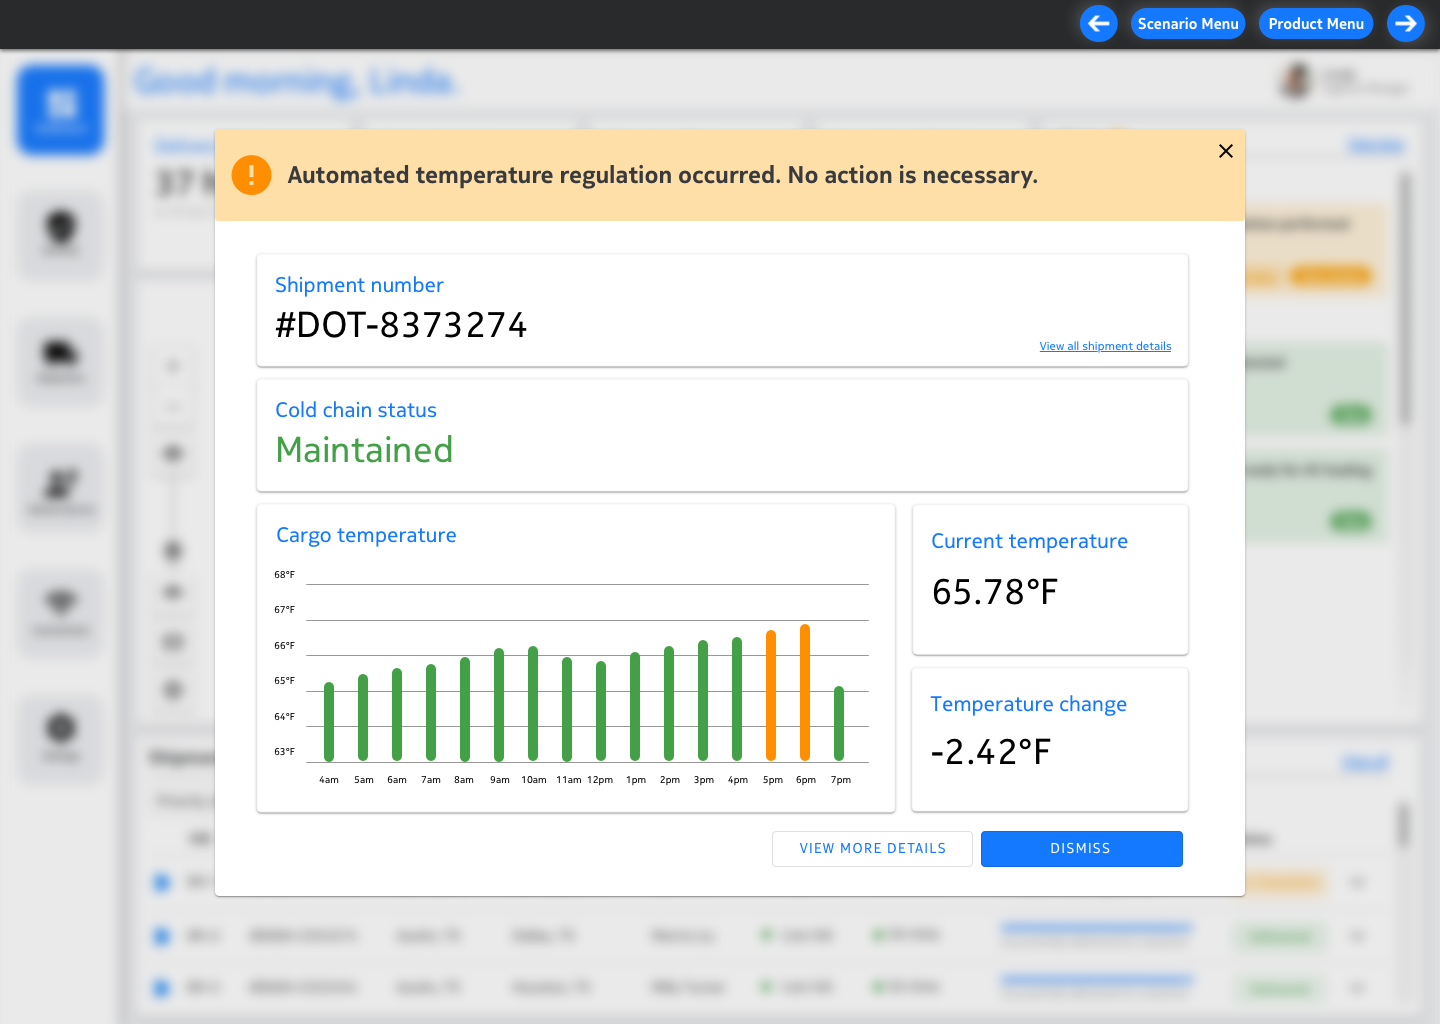
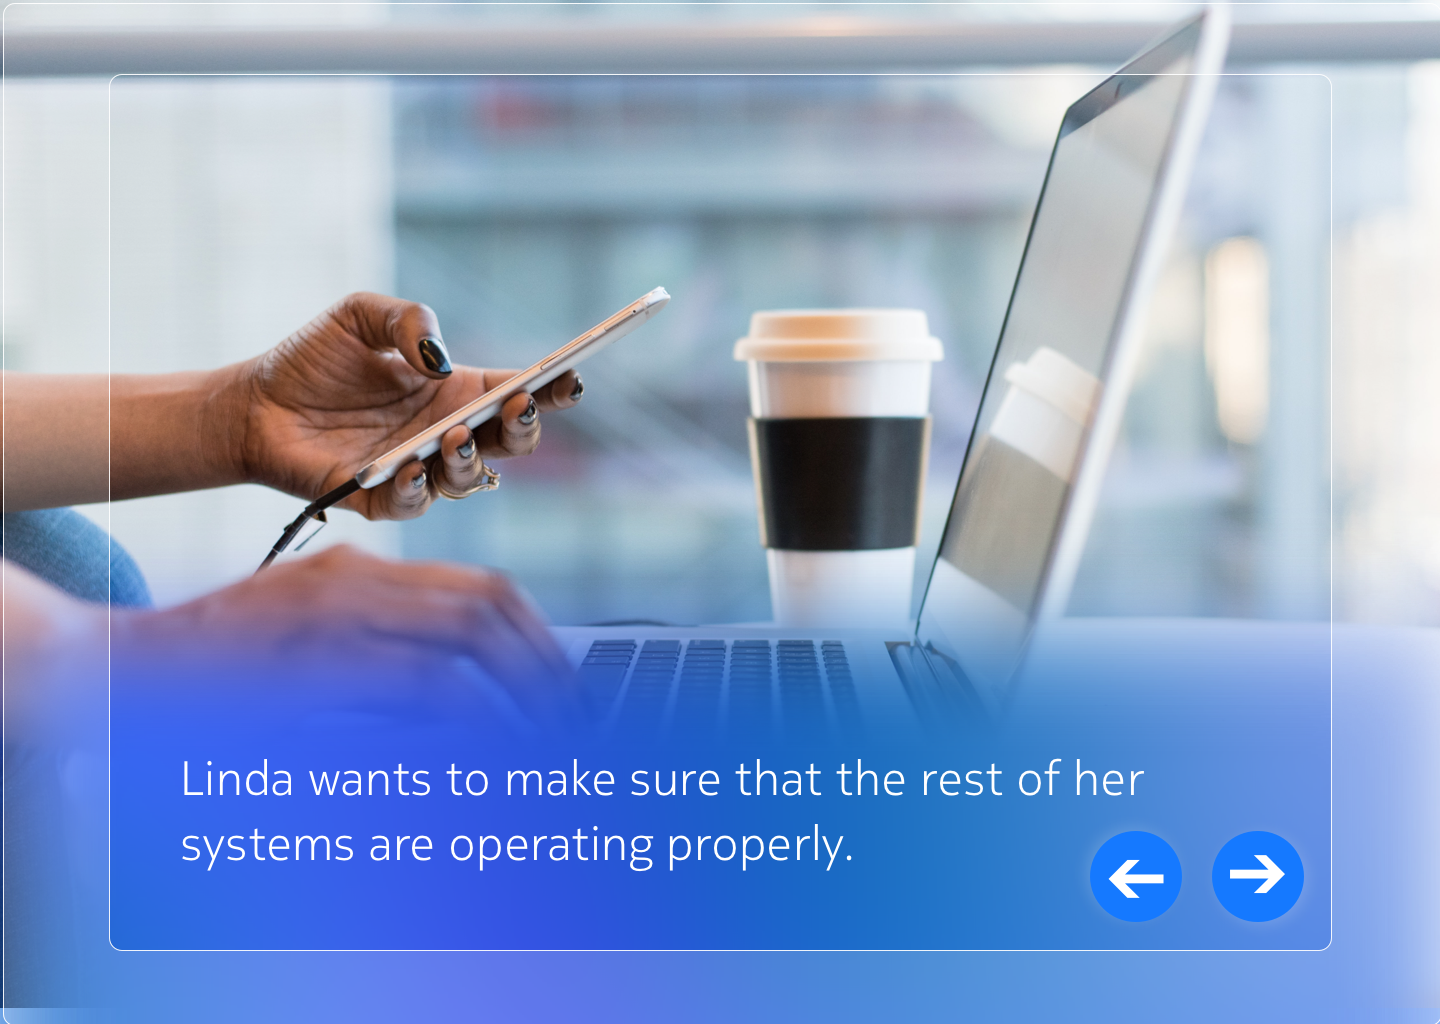
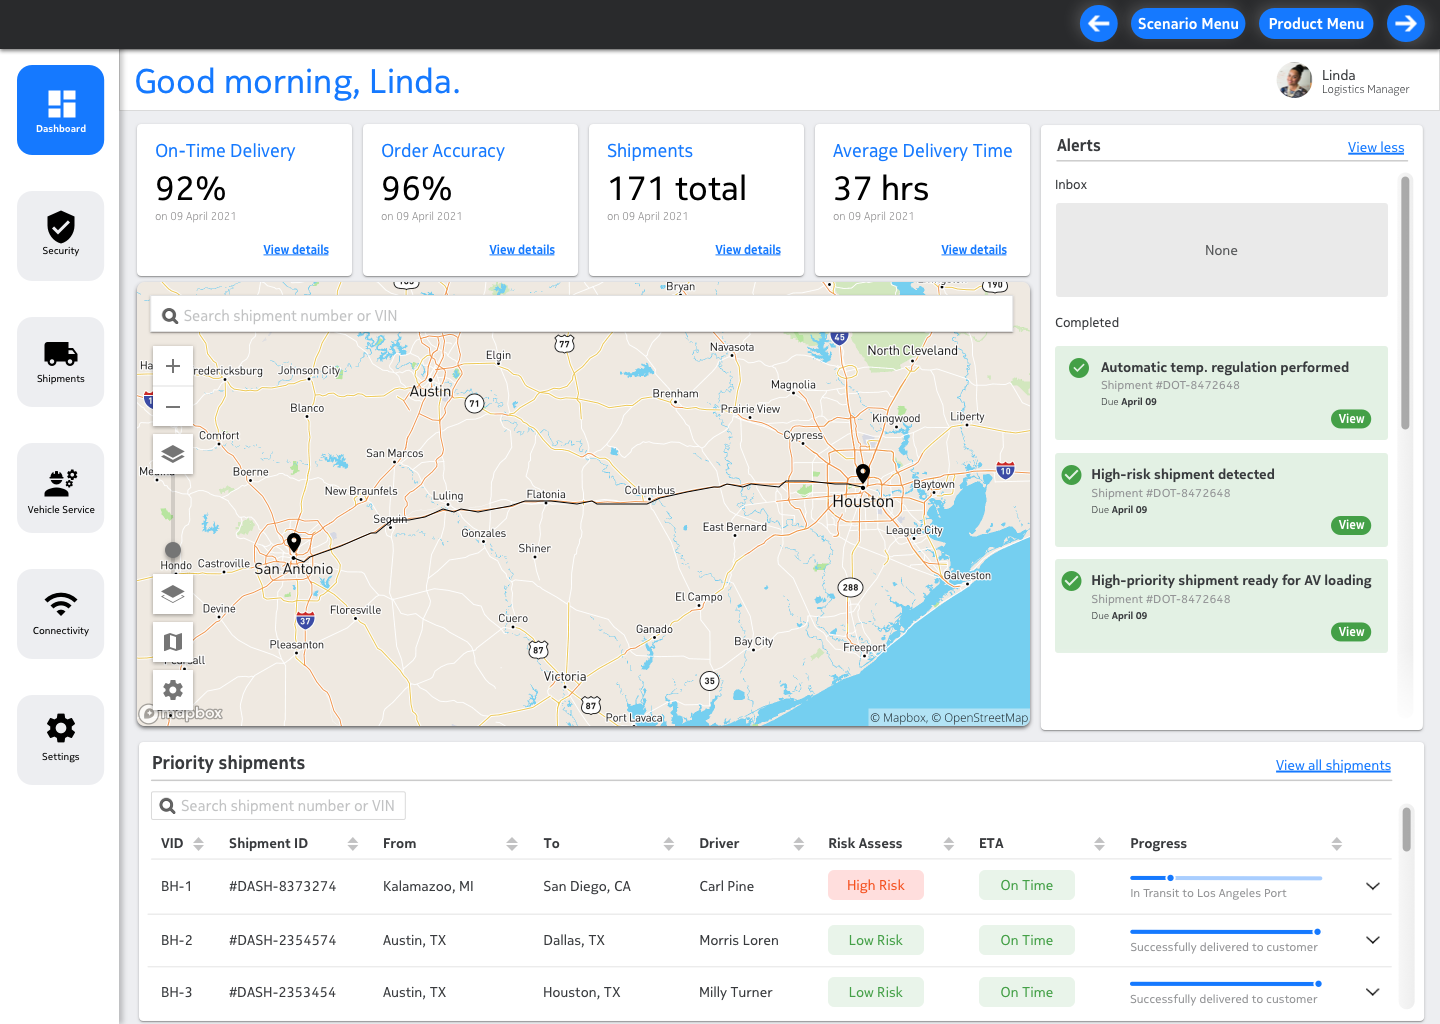
Below is the sequence I designed for the dynamic temperature regulation touchpoint. In this scenario, cold chain cargo reaches a dangerously high temperature. Linda receives a notification that automatic temperature regulation has occurred, and then she checks the connection of the rest of her 5G devices to ensure there are no Service Level Agreement violations
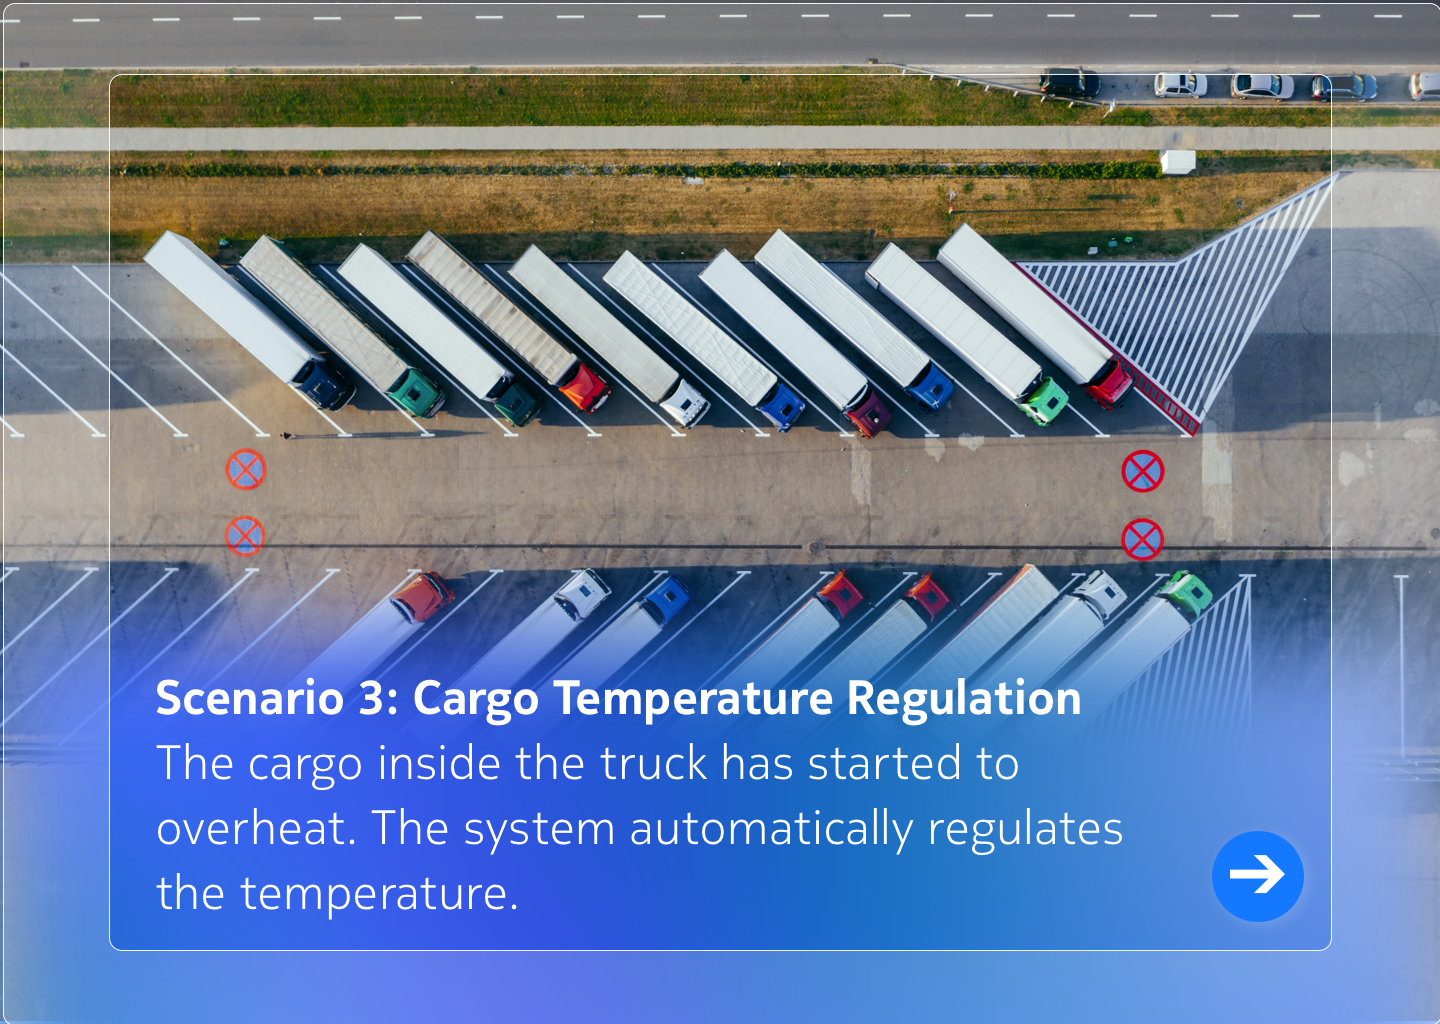
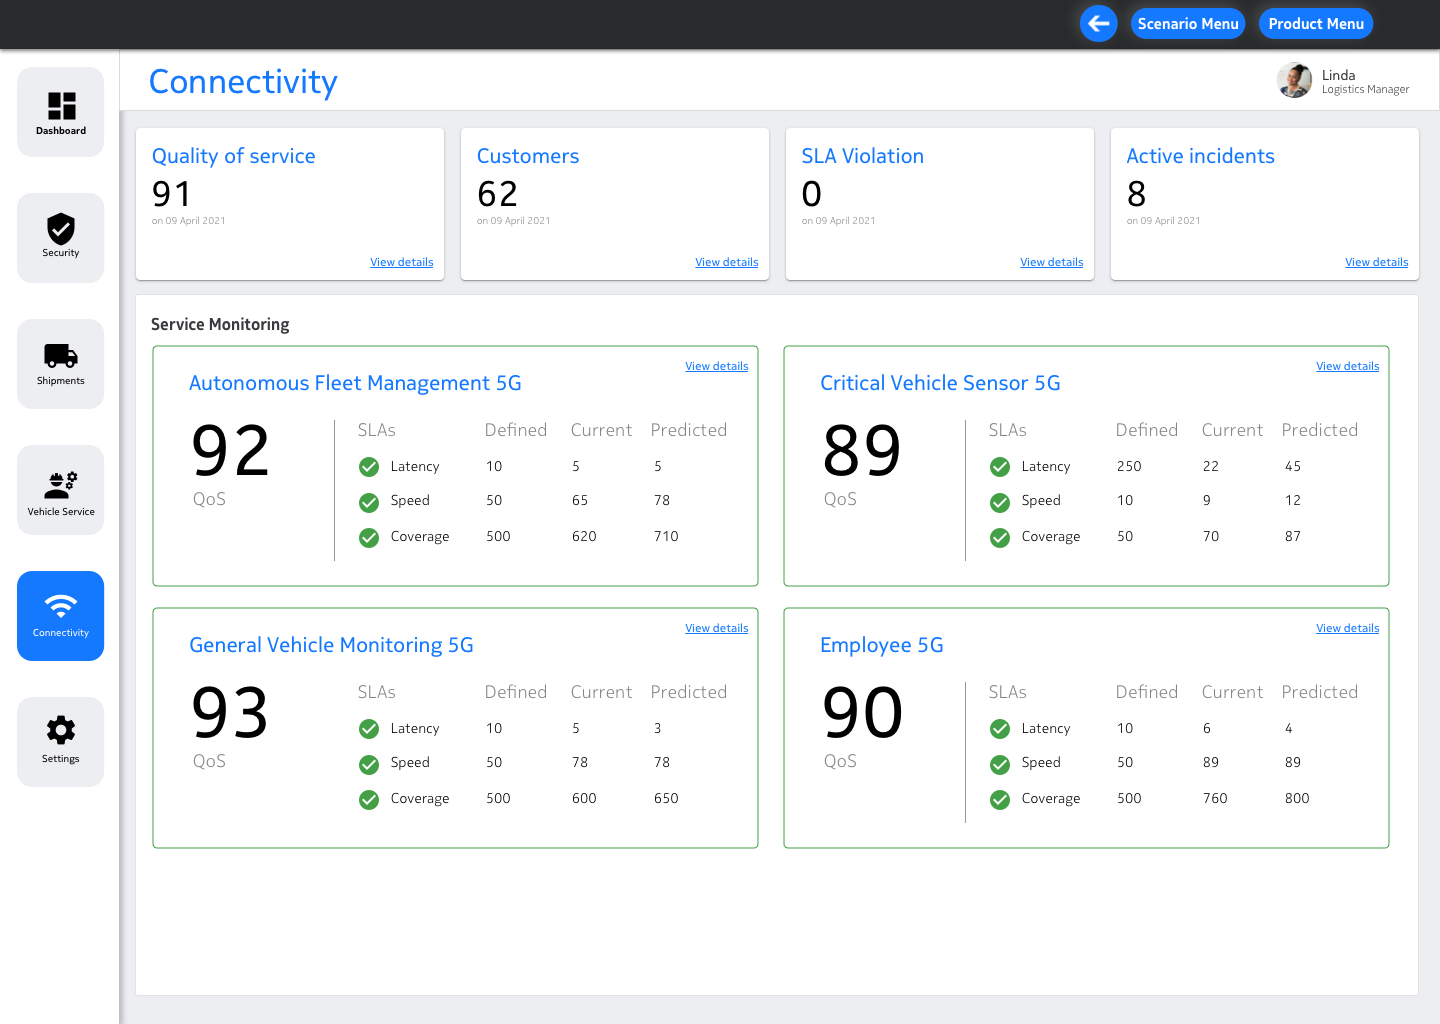
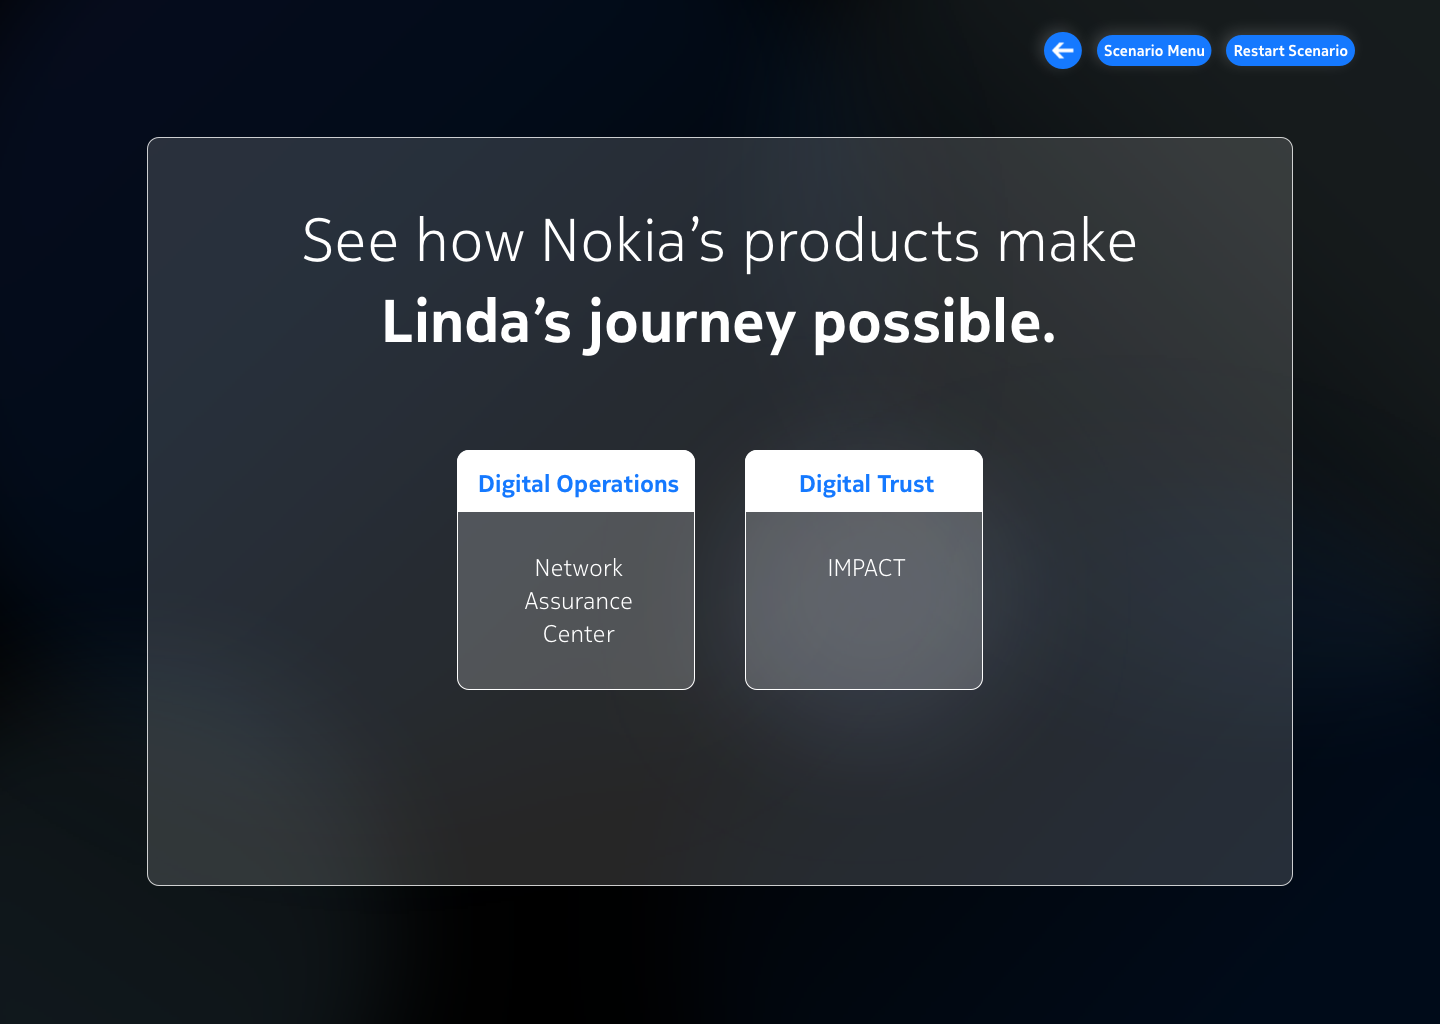
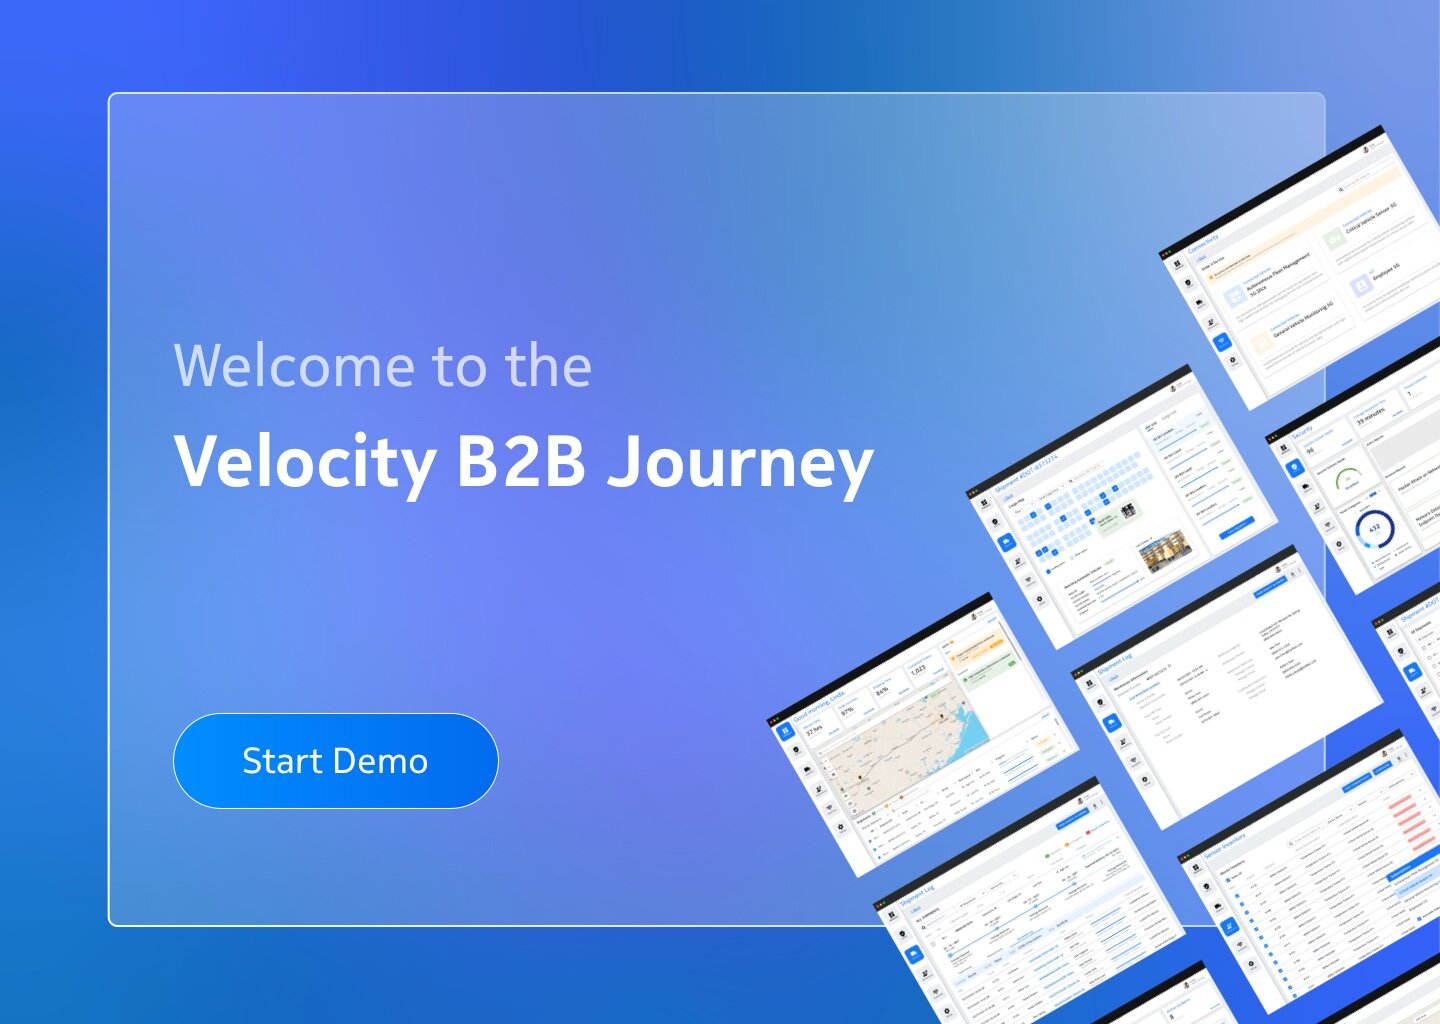
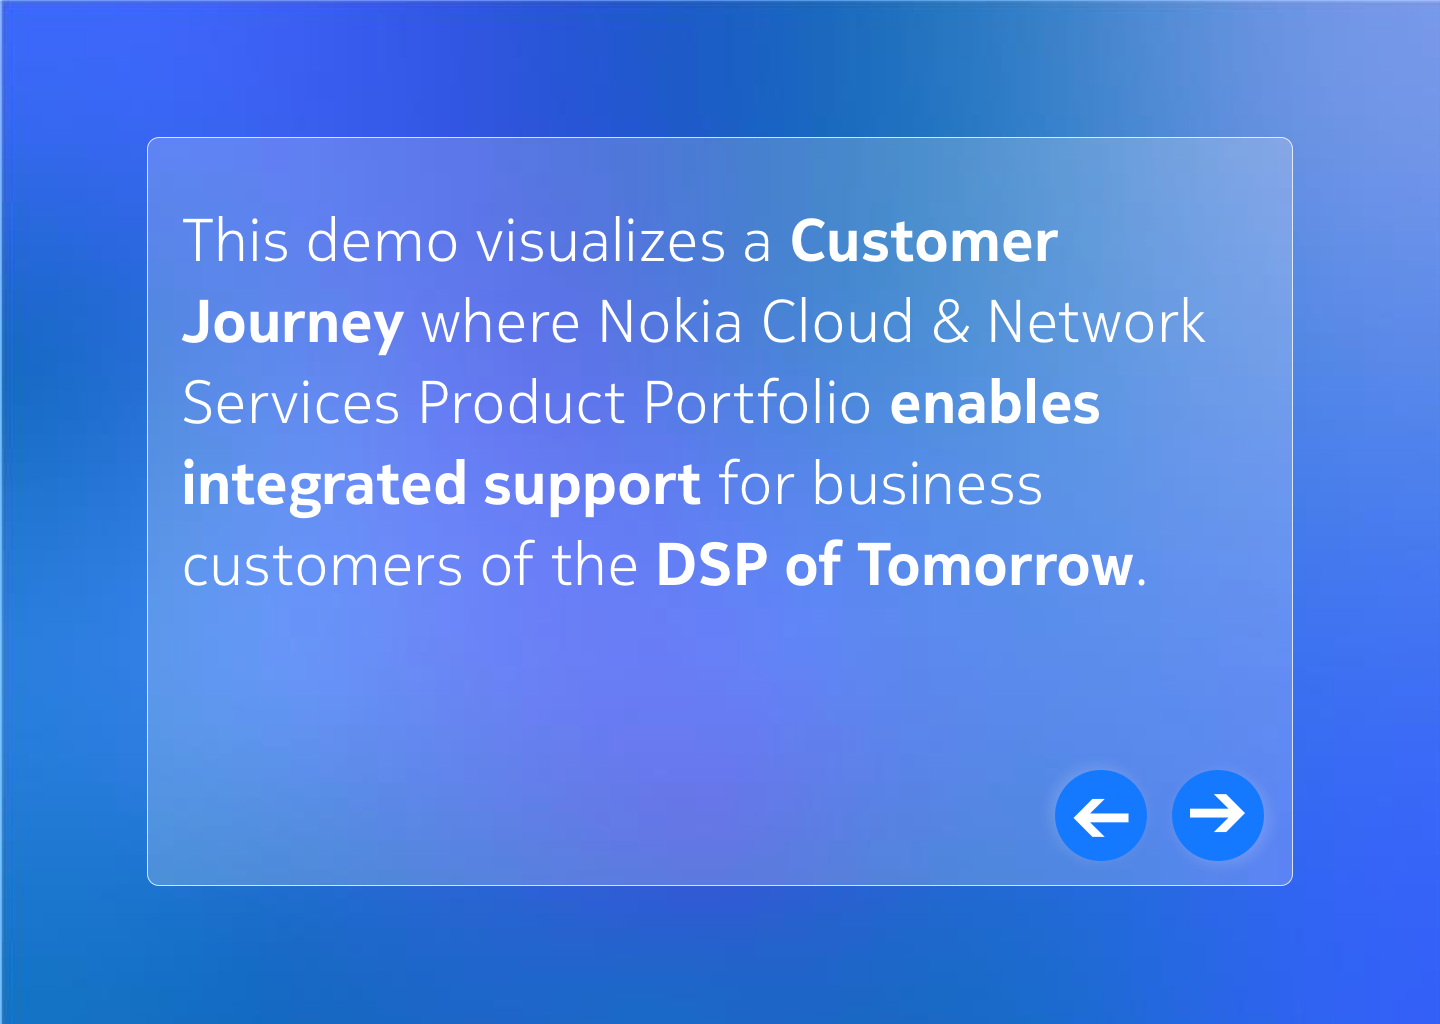
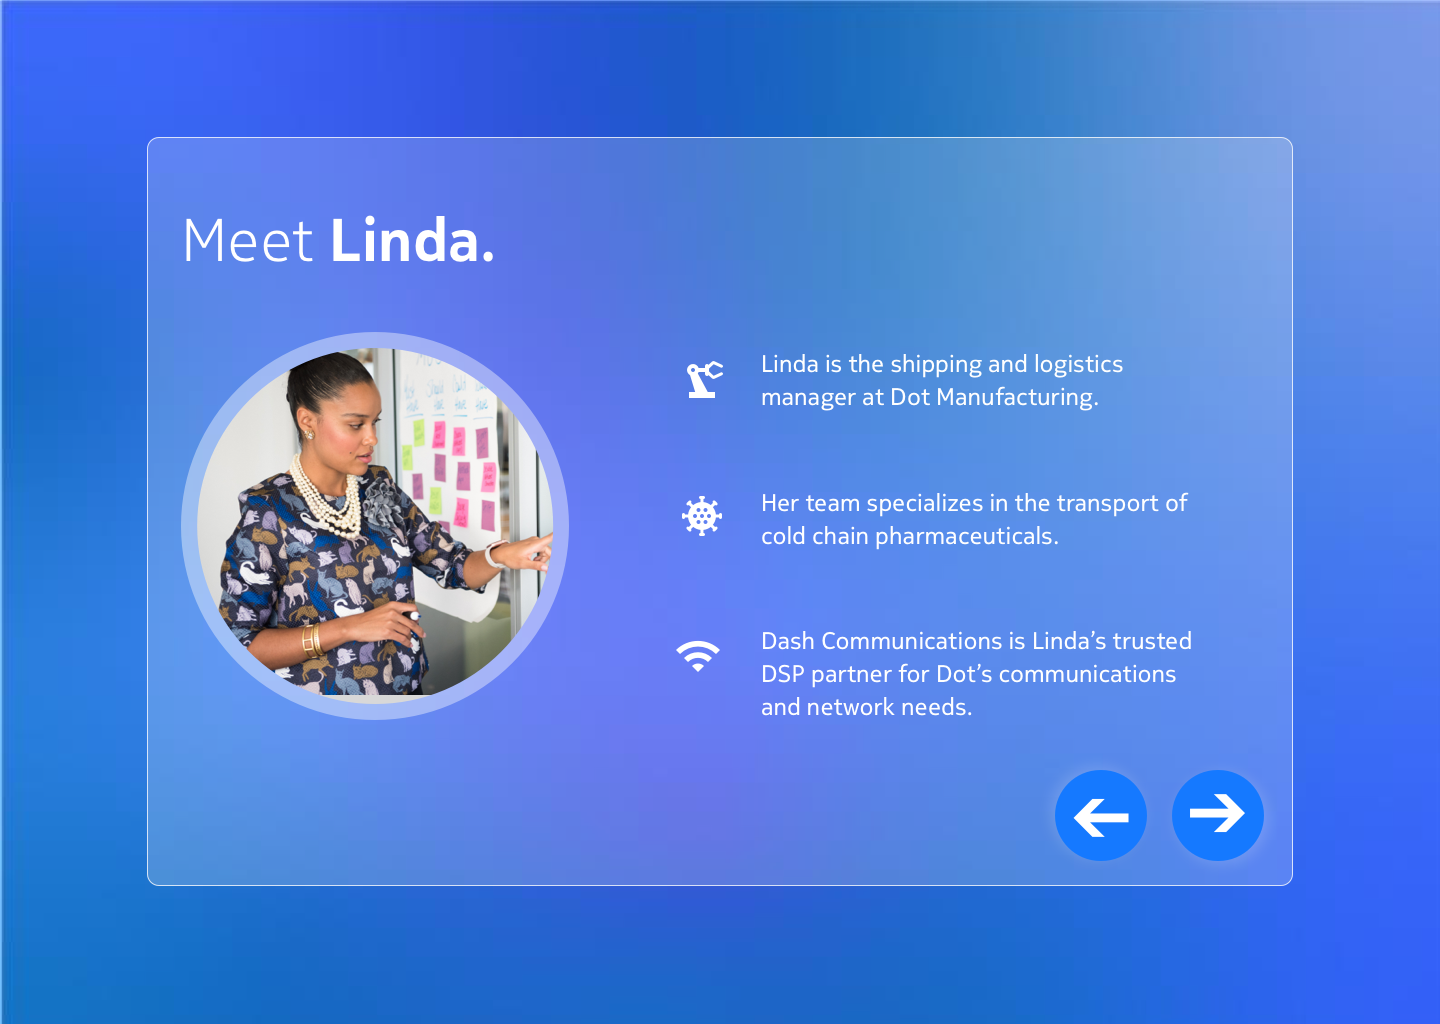
Similar to our previous Velocity demo, I also had the chance to design the introductory screens for the demo, where we introduce the demo and our persona, set the stage, and allow the salesperson to select which journey touchpoints they’d like to cover with customers.
Outcome
The completed demo was then handed off to the content and communications strategist, who developed a script and walkthrough video of the demo to create a Demo Success Kit. The kit also included a navigation guide and e-learning course. The demo was then handed off to our development team, who coded the demo so that the map and inbox widgets could operate live. Finally, the demo was packaged and circulated to our global sales team through two global sales trainings, which I lead. The outcome was over 40 sales folks from across all seven global sales regions.
Reflection
Following up our first Velocity demo left some big shoes to fill. This project was significantly more difficult because unlike the B2C demo, we were unable to imagine ourselves as the users, instead tackling a the complex use case of shipping and logistics for cold chain pharmaceuticals. One regret I have is not taking our prototype to Jothika, the North American shipping Hub Manager, for testing and validation. While Jothika’s interview heavily influenced and informed our insights and initial part of the design process, we failed to take advantage of her experience as the project progressed. Validating our prototype with her could have provided valuable insights.
When it comes to our design principles, our prototype and demo did hit those marks. We empowered Linda and her team with actionable data and increased supply chain transparency, in turn pulling her ahead of the hypothetical competition. Our demo showcased seven different interactive storylines, therefore being versatile for different customer conversations and a more engaging storytelling experience than a static PowerPoint.
Our sales trainings had significantly lower attendance compared to our B2C trainings—40 compared to B2C’s 140—but according to the sales training coordinator, this is due to the trainings taking place during the summer, when many of our sales folks are on vacation or busy closing other deals.
One final regret is not following up with the sales folks who did attend our training to receive further testimonials and feedback.